|
1000
|
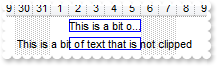
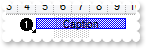
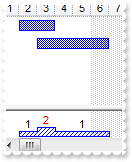
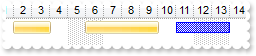
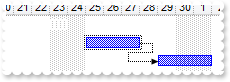
It is possible to clip the bar's caption to bar, when the time scale is changed
OleObject oG2antt,var_Bar,var_Chart,var_Items
any h

oG2antt = ole_1.Object
oG2antt.Columns.Add("Task")
var_Chart = oG2antt.Chart
	var_Chart.PaneWidth(false,48)
	var_Chart.FirstVisibleDate = 2000-12-27
	var_Bar = var_Chart.Bars.Item("Task")
		var_Bar.Pattern = 32
		var_Bar.Height = 13
var_Items = oG2antt.Items
	h = var_Items.AddItem("Task 1")
	var_Items.AddBar(h,"Task",2001-01-02,2001-01-06,"K1","This is a bit of text that get's clipped")
	var_Items.ItemBar(h,"K1",4,4)
	var_Items.ItemBar(h,"K1",6,var_Items.ItemBar(h,"K1",3))
	h = var_Items.AddItem("Task 2")
	var_Items.AddBar(h,"Task",2001-01-02,2001-01-06,"K1","This is a bit of text that is not clipped")
	var_Items.ItemBar(h,"K1",4,1)
|
|
999
|
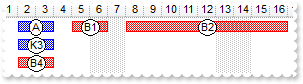
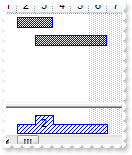
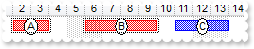
How can I change the color for all bars with the key matching a pattern
OleObject oG2antt,var_Items
any h

oG2antt = ole_1.Object
oG2antt.Columns.Add("Task")
oG2antt.Chart.FirstVisibleDate = 2001-01-01
oG2antt.Chart.PaneWidth(false,64)
oG2antt.Debug = true
var_Items = oG2antt.Items
	h = var_Items.AddItem("Task 1")
	var_Items.AddBar(h,"Task",2001-01-02,2001-01-04,"A")
	var_Items.AddBar(h,"Task",2001-01-05,2001-01-07,"B1")
	var_Items.AddBar(h,"Task",2001-01-08,2001-01-17,"B2")
	var_Items.AddBar(var_Items.AddItem("Task 2"),"Task",2001-01-02,2001-01-04,"K3")
	var_Items.AddBar(var_Items.AddItem("Task 4"),"Task",2001-01-02,2001-01-04,"B4")
	var_Items.ItemBar(0,"<B*>",33,255)
|
|
998
|
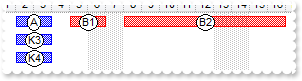
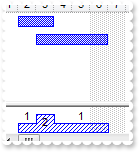
How can I change the color for all bars in the same item with the key matching a pattern
OleObject oG2antt,var_Items
any h

oG2antt = ole_1.Object
oG2antt.Columns.Add("Task")
oG2antt.Chart.FirstVisibleDate = 2001-01-01
oG2antt.Chart.PaneWidth(false,64)
oG2antt.Debug = true
var_Items = oG2antt.Items
	h = var_Items.AddItem("Task 1")
	var_Items.AddBar(h,"Task",2001-01-02,2001-01-04,"A")
	var_Items.AddBar(h,"Task",2001-01-05,2001-01-07,"B1")
	var_Items.AddBar(h,"Task",2001-01-08,2001-01-17,"B2")
	var_Items.AddBar(var_Items.AddItem("Task 2"),"Task",2001-01-02,2001-01-04,"K3")
	var_Items.AddBar(var_Items.AddItem("Task 4"),"Task",2001-01-02,2001-01-04,"K4")
	var_Items.ItemBar(h,"<B*>",33,255)
|
|
997
|
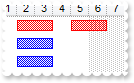
How can I change the color for all bars in the same item
OleObject oG2antt,var_Items
any h

oG2antt = ole_1.Object
oG2antt.Columns.Add("Task")
oG2antt.Chart.FirstVisibleDate = 2001-01-01
var_Items = oG2antt.Items
	h = var_Items.AddItem("Task 1")
	var_Items.AddBar(h,"Task",2001-01-02,2001-01-04,"K1")
	var_Items.AddBar(h,"Task",2001-01-05,2001-01-07,"K2")
	var_Items.AddBar(var_Items.AddItem("Task 2"),"Task",2001-01-02,2001-01-04,"K3")
	var_Items.AddBar(var_Items.AddItem("Task 4"),"Task",2001-01-02,2001-01-04,"K4")
	var_Items.ItemBar(h,"<*>",33,255)
|
|
996
|
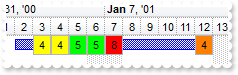
How can I write a special number for each date related to a bar
OleObject oG2antt,var_Chart,var_Items,var_Note,var_Note1,var_Note2,var_Note3,var_Note4,var_Note5,var_Notes
any h

oG2antt = ole_1.Object
oG2antt.BeginUpdate()
oG2antt.Columns.Add("Task")
var_Chart = oG2antt.Chart
	var_Chart.FirstVisibleDate = 2001-01-01
	var_Chart.PaneWidth(false,32)
	var_Chart.LevelCount = 2
var_Items = oG2antt.Items
	h = var_Items.AddItem("Task")
	var_Items.AddBar(h,"Task",2001-01-02,2001-01-13,"1")
var_Notes = oG2antt.Chart.Notes
	var_Note = var_Notes.Add("N1",oG2antt.Items.FirstVisibleItem,"1","")
		var_Note.RelativePosition = "S+2"
		var_Note.PartText(0,"4")
		var_Note.PartFixedWidth(0,18)
		var_Note.PartHOffset(0,-9)
		var_Note.PartBackColor(0,RGB(255,255,0))
		var_Note.ShowLink = 0
		var_Note.PartVisible(0,true)
	var_Note1 = var_Notes.Add("N2",oG2antt.Items.FirstVisibleItem,"1","")
		var_Note1.RelativePosition = "S+3"
		var_Note1.PartText(0,"4")
		var_Note1.PartFixedWidth(0,18)
		var_Note1.PartHOffset(0,-9)
		var_Note1.PartBackColor(0,RGB(255,255,0))
		var_Note1.ShowLink = 0
		var_Note1.PartVisible(0,true)
	var_Note2 = var_Notes.Add("N3",oG2antt.Items.FirstVisibleItem,"1","")
		var_Note2.RelativePosition = "S+4"
		var_Note2.PartText(0,"5")
		var_Note2.PartFixedWidth(0,18)
		var_Note2.PartHOffset(0,-9)
		var_Note2.PartBackColor(0,RGB(0,255,0))
		var_Note2.ShowLink = 0
		var_Note2.PartVisible(0,true)
	var_Note3 = var_Notes.Add("N4",oG2antt.Items.FirstVisibleItem,"1","")
		var_Note3.RelativePosition = "S+5"
		var_Note3.PartText(0,"5")
		var_Note3.PartFixedWidth(0,18)
		var_Note3.PartHOffset(0,-9)
		var_Note3.PartBackColor(0,RGB(0,255,0))
		var_Note3.ShowLink = 0
		var_Note3.PartVisible(0,true)
	var_Note4 = var_Notes.Add("N5",oG2antt.Items.FirstVisibleItem,"1","")
		var_Note4.RelativePosition = "S+6"
		var_Note4.PartText(0,"8")
		var_Note4.PartFixedWidth(0,18)
		var_Note4.PartHOffset(0,-9)
		var_Note4.PartBackColor(0,RGB(255,0,0))
		var_Note4.ShowLink = 0
		var_Note4.PartVisible(0,true)
	var_Note5 = var_Notes.Add("Z",oG2antt.Items.FirstVisibleItem,"1","")
		var_Note5.RelativePosition = "E"
		var_Note5.PartText(0,"4")
		var_Note5.PartFixedWidth(0,18)
		var_Note5.PartHOffset(0,-9)
		var_Note5.PartBackColor(0,RGB(255,128,0))
		var_Note5.PartCanMove(0,true)
		var_Note5.ShowLink = 0
		var_Note5.PartVisible(0,true)
oG2antt.EndUpdate()
|
|
995
|
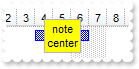
How can I assign a note to be always in the center of the bar
OleObject oG2antt,var_Items,var_Note,var_Notes
any h

oG2antt = ole_1.Object
oG2antt.BeginUpdate()
oG2antt.Columns.Add("Task")
oG2antt.Chart.FirstVisibleDate = 2001-01-01
oG2antt.Chart.PaneWidth(false,96)
var_Items = oG2antt.Items
	h = var_Items.AddItem("Task 1")
	var_Items.AddBar(h,"Task",2001-01-05,2001-01-08,"1")
var_Notes = oG2antt.Chart.Notes
	var_Note = var_Notes.Add("Note",oG2antt.Items.FirstVisibleItem,"1","")
		var_Note.RelativePosition = 0.5
		var_Note.PartText(0,"note<br>center")
		var_Note.PartBackColor(0,RGB(255,255,0))
		var_Note.PartVisible(1,false)
		var_Note.ShowLink = 0
oG2antt.EndUpdate()
|
|
994
|
How can I assign a note relative to the start of the bar, and let it be movable

OleObject oG2antt,var_Items,var_Note,var_Notes
any h

oG2antt = ole_1.Object
oG2antt.BeginUpdate()
oG2antt.Columns.Add("Task")
oG2antt.Chart.FirstVisibleDate = 2001-01-01
oG2antt.Chart.PaneWidth(false,96)
var_Items = oG2antt.Items
	h = var_Items.AddItem("Task 1")
	var_Items.AddBar(h,"Task",2001-01-05,2001-01-08,"1")
var_Notes = oG2antt.Chart.Notes
	var_Note = var_Notes.Add("Note",oG2antt.Items.FirstVisibleItem,"1","")
		var_Note.RelativePosition = "S+1"
		var_Note.PartText(0,"<%d%>")
		var_Note.PartFixedWidth(0,18)
		var_Note.PartHOffset(0,9)
		var_Note.PartCanMove(0,true)
		var_Note.PartBackColor(0,RGB(255,255,0))
		var_Note.PartVisible(1,false)
		var_Note.ShowLink = 0
oG2antt.EndUpdate()
|
|
993
|
How can I associate a note relative to the start of the bar

OleObject oG2antt,var_Items,var_Note,var_Notes
any h

oG2antt = ole_1.Object
oG2antt.BeginUpdate()
oG2antt.Columns.Add("Task")
oG2antt.Chart.FirstVisibleDate = 2001-01-01
oG2antt.Chart.PaneWidth(false,96)
var_Items = oG2antt.Items
	h = var_Items.AddItem("Task 1")
	var_Items.AddBar(h,"Task",2001-01-05,2001-01-08,"1")
var_Notes = oG2antt.Chart.Notes
	var_Note = var_Notes.Add("Note",oG2antt.Items.FirstVisibleItem,"1","")
		var_Note.RelativePosition = "S+1"
		var_Note.PartText(0,"<%d%>")
		var_Note.PartFixedWidth(0,18)
		var_Note.PartHOffset(0,9)
		var_Note.PartBackColor(0,RGB(255,255,0))
		var_Note.PartVisible(1,false)
		var_Note.ShowLink = 0
oG2antt.EndUpdate()
|
|
992
|
How can I associate a note relative to the end of the bar, so if the bar is resized at the end, the not is moved accordingly

OleObject oG2antt,var_Items,var_Note,var_Notes
any h

oG2antt = ole_1.Object
oG2antt.BeginUpdate()
oG2antt.Columns.Add("Task")
oG2antt.Chart.FirstVisibleDate = 2001-01-01
oG2antt.Chart.PaneWidth(false,96)
var_Items = oG2antt.Items
	h = var_Items.AddItem("Task 1")
	var_Items.AddBar(h,"Task",2001-01-05,2001-01-08,"1")
var_Notes = oG2antt.Chart.Notes
	var_Note = var_Notes.Add("Note",oG2antt.Items.FirstVisibleItem,"1","")
		var_Note.RelativePosition = "E-1"
		var_Note.PartText(0,"<%d%>")
		var_Note.PartFixedWidth(0,18)
		var_Note.PartHOffset(0,9)
		var_Note.PartVisible(1,false)
		var_Note.ShowLink = 0
oG2antt.EndUpdate()
|
|
991
|
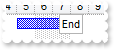
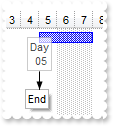
How can I associate a note relative to the end of the bar, so if the bar is resized at the end, the not is moved accordingly
OleObject oG2antt,var_Items,var_Note,var_Notes
any h

oG2antt = ole_1.Object
oG2antt.BeginUpdate()
oG2antt.Columns.Add("Task")
oG2antt.Chart.FirstVisibleDate = 2001-01-01
oG2antt.Chart.PaneWidth(false,96)
var_Items = oG2antt.Items
	h = var_Items.AddItem("Task 1")
	var_Items.AddBar(h,"Task",2001-01-05,2001-01-08,"1")
var_Notes = oG2antt.Chart.Notes
	var_Note = var_Notes.Add("Note",oG2antt.Items.FirstVisibleItem,"1","")
		var_Note.RelativePosition = 1
		var_Note.PartText(0,"End")
		var_Note.PartVisible(1,false)
		var_Note.ShowLink = 0
oG2antt.EndUpdate()
|
|
990
|
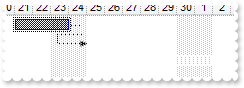
How can I hide a bar without removing it
OleObject oG2antt,var_Chart,var_Items

oG2antt = ole_1.Object
oG2antt.BeginUpdate()
var_Chart = oG2antt.Chart
	var_Chart.FirstVisibleDate = 2001-01-01
	var_Chart.PaneWidth(false,128)
	var_Chart.LevelCount = 2
oG2antt.HeaderVisible = 1
oG2antt.Columns.Add("Column")
var_Items = oG2antt.Items
	var_Items.AddBar(var_Items.AddItem("Item 1"),"Task",2001-01-02,2001-01-04,"B1")
	var_Items.AddBar(var_Items.AddItem("Item 2"),"Task",2001-01-06,2001-01-14,"B2")
	var_Items.AddLink("L1",var_Items.FindItem("Item 1",0),"B1",var_Items.FindItem("Item 2",0),"B2")
	var_Items.ItemBar(var_Items.FirstVisibleItem,var_Items.FirstItemBar(var_Items.FirstVisibleItem),19,100)
oG2antt.EndUpdate()
|
|
989
|
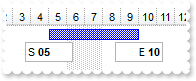
How can I align the caption in the note
OleObject oG2antt,var_Items,var_Note,var_Note1,var_Notes
any h

oG2antt = ole_1.Object
oG2antt.BeginUpdate()
oG2antt.Columns.Add("Task")
oG2antt.Chart.FirstVisibleDate = 2001-01-01
oG2antt.Chart.PaneWidth(false,96)
var_Items = oG2antt.Items
	h = var_Items.AddItem("Task 1")
	var_Items.AddBar(h,"Task",2001-01-05,2001-01-08,"1")
var_Notes = oG2antt.Chart.Notes
	var_Note = var_Notes.Add("N1",oG2antt.Items.FirstVisibleItem,"1","")
		var_Note.ShowLink = 0
		var_Note.PartVisible(1,false)
		var_Note.PartText(0,"S <b><%dd%></b>")
		var_Note.PartFixedWidth(0,48)
		var_Note.PartAlignment(0,0)
		var_Note.PartVOffset(0,17)
	var_Note1 = var_Notes.Add("N2",oG2antt.Items.FirstVisibleItem,"1","")
		var_Note1.RelativePosition = 1
		var_Note1.ShowLink = 0
		var_Note1.PartVisible(1,false)
		var_Note1.PartText(0,"E <b><%dd%></b>")
		var_Note1.PartFixedWidth(0,48)
		var_Note1.PartAlignment(0,2)
		var_Note1.PartVOffset(0,17)
oG2antt.EndUpdate()
|
|
988
|
How I can assign a note and let user move the note relative to the bar
OleObject oG2antt,var_Items,var_Note,var_Notes
any h

oG2antt = ole_1.Object
oG2antt.BeginUpdate()
oG2antt.Columns.Add("Task")
oG2antt.Chart.FirstVisibleDate = 2001-01-01
oG2antt.Chart.PaneWidth(false,96)
var_Items = oG2antt.Items
	h = var_Items.AddItem("Task 1")
	var_Items.AddBar(h,"Task",2001-01-05,2001-01-08,"1")
var_Notes = oG2antt.Chart.Notes
	var_Note = var_Notes.Add("Note",oG2antt.Items.FirstVisibleItem,"1","End")
		var_Note.PartText(0,"Day<br> <%dd%>")
		var_Note.PartCanMove(0,true)
		var_Note.PartVOffset(0,16)
		var_Note.PartTransparency(0,30)
		var_Note.PartToolTip(0,"Click the note and start moving to a new position.")
oG2antt.EndUpdate()
|
|
987
|
How can I assign a picture as a note associated with a bar
OleObject oG2antt,var_Items,var_Note,var_Note1,var_Notes
any h

oG2antt = ole_1.Object
oG2antt.BeginUpdate()
oG2antt.HTMLPicture("pic1","c:\exontrol\images\zipdisk.gif")
oG2antt.HTMLPicture("pic2","c:\exontrol\images\auction.gif")
oG2antt.AntiAliasing = true
oG2antt.Columns.Add("Task")
oG2antt.Chart.FirstVisibleDate = 2001-01-01
oG2antt.Chart.PaneWidth(false,96)
var_Items = oG2antt.Items
	h = var_Items.AddItem("Task 1")
	var_Items.AddBar(h,"Task",2001-01-05,2001-01-08,"1")
	h = var_Items.AddItem("Task 2")
	var_Items.AddBar(h,"Task",2001-01-07,2001-01-11,"2")
var_Notes = oG2antt.Chart.Notes
	var_Note = var_Notes.Add("1",oG2antt.Items.ItemByIndex(0),"1","<img>pic1</img>")
		var_Note.PartShadow(1,false)
		var_Note.PartBorderSize(1,0)
		var_Note.ClearPartBackColor(1)
		var_Note.PartHOffset(1,-64)
		var_Note.PartCanMove(1,true)
	var_Note1 = var_Notes.Add("2",oG2antt.Items.ItemByIndex(1),"2","<img>pic2</img>")
		var_Note1.PartShadow(1,false)
		var_Note1.PartBorderSize(1,0)
		var_Note1.ClearPartBackColor(1)
		var_Note1.RelativePosition = 1
		var_Note1.PartCanMove(1,true)
		var_Note1.LinkColor = RGB(255,0,0)
		var_Note1.LinkWidth = 2
		var_Note1.LinkStyle = 2
		var_Note1.ShowLink = 1
oG2antt.EndUpdate()
|
|
986
|
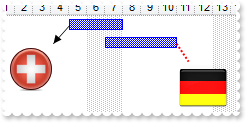
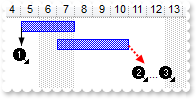
How can I assign a picture as a note associated with a bar
OleObject oG2antt,var_Items,var_Note,var_Note1,var_Notes
any h

oG2antt = ole_1.Object
oG2antt.BeginUpdate()
oG2antt.Images("gBJJgBAIDAAGAAEAAQhYAf8Pf4hh0QihCJo2AEZjQAjEZFEaIEaEEaAIAkcbk0olUrlktl0vmExmUzmk1m03nE5nU7nk9n0/oFBoVDolFo1HpFJpVLplNp1PqFRqVTqlVq1XrFZrVbrldr1fsFhsVjslls1ntFptVrtltt1vuFxuVzul1u13vF5vV7vl9v1/wGBwWDwmFw2HxGJxWLxmNx0xiFdyOTh8Tf9ZymXx+QytcyNgz8r0OblWjyWds+m0ka1Vf1ta1+r1mos2xrG2xeZ0+a0W0qOx3GO4NV3WeyvD2XJ5XL5nN51aiw+lfSj0gkUkAEllHanHI5j/cHg8EZf7w8vl8j4f/qfEZeB09/vjLAB30+kZQAP/P5/H6/yNAOAEAwCjMBwFAEDwJBMDwLBYAP2/8Hv8/gAGAD8LQs9w/nhDY/oygIA=")
oG2antt.AntiAliasing = true
oG2antt.Columns.Add("Task")
oG2antt.Chart.FirstVisibleDate = 2001-01-01
oG2antt.Chart.PaneWidth(false,96)
var_Items = oG2antt.Items
	h = var_Items.AddItem("Task 1")
	var_Items.AddBar(h,"Task",2001-01-05,2001-01-08,"1")
	h = var_Items.AddItem("Task 2")
	var_Items.AddBar(h,"Task",2001-01-07,2001-01-11,"2")
var_Notes = oG2antt.Chart.Notes
	var_Note = var_Notes.Add("1",oG2antt.Items.ItemByIndex(0),"1","<img>1</img>")
		var_Note.PartShadow(1,false)
		var_Note.PartBorderSize(1,0)
		var_Note.ClearPartBackColor(1)
	var_Note1 = var_Notes.Add("2",oG2antt.Items.ItemByIndex(1),"2","<img>2</img>...<img>3</img>")
		var_Note1.PartShadow(1,false)
		var_Note1.PartBorderSize(1,0)
		var_Note1.ClearPartBackColor(1)
		var_Note1.RelativePosition = 1
		var_Note1.PartCanMove(1,true)
		var_Note1.LinkColor = RGB(255,0,0)
		var_Note1.LinkWidth = 2
		var_Note1.LinkStyle = 2
oG2antt.EndUpdate()
|
|
985
|
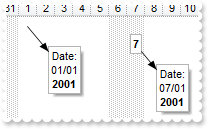
How can I put a box assigned to a DATE
OleObject oG2antt,var_Items,var_Note,var_Note1,var_Notes
any h

oG2antt = ole_1.Object
oG2antt.BeginUpdate()
oG2antt.Columns.Add("Task")
oG2antt.Chart.FirstVisibleDate = 2001-01-01
oG2antt.Chart.PaneWidth(false,96)
var_Items = oG2antt.Items
	h = var_Items.AddItem("Item 1")
	h = var_Items.AddItem("Item 2")
var_Notes = oG2antt.Chart.Notes
	var_Note = var_Notes.Add("D1",oG2antt.Items.FirstVisibleItem,oG2antt.Chart.FirstVisibleDate,"Date:<br><%dd%>/<%mm%><br><b><%yyyy%></b>")
		var_Note.PartCanMove(1,true)
		var_Note.PartVOffset(1,20)
		var_Note.PartHOffset(1,20)
	var_Note1 = var_Notes.Add("D2",oG2antt.Items.NextVisibleItem(oG2antt.Items.FirstVisibleItem),2001-01-07,"Date:<br><%dd%>/<%mm%><br><b><%yyyy%></b>")
		var_Note1.PartVisible(0,true)
		var_Note1.PartText(0,"<b><%d%></b>")
		var_Note1.PartCanMove(1,true)
		var_Note1.PartVOffset(1,20)
		var_Note1.PartHOffset(1,20)
oG2antt.EndUpdate()
|
|
984
|
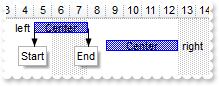
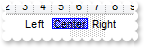
How can I add a note or a box associated with a bar
OleObject oG2antt,var_Items,var_Notes
any h

oG2antt = ole_1.Object
oG2antt.BeginUpdate()
oG2antt.Columns.Add("Task")
oG2antt.Chart.FirstVisibleDate = 2001-01-01
oG2antt.Chart.PaneWidth(false,96)
var_Items = oG2antt.Items
	h = var_Items.AddItem("Task 1")
	var_Items.AddBar(h,"Task",2001-01-05,2001-01-08,"1","Center")
	var_Items.ItemBar(h,"1",44,"left")
	var_Items.ItemBar(h,"1",45,16)
	h = var_Items.AddItem("Task 2")
	var_Items.AddBar(h,"Task",2001-01-07,2001-01-11,"2","Center")
	var_Items.ItemBar(h,"2",44,"right")
	var_Items.ItemBar(h,"2",45,18)
var_Notes = oG2antt.Chart.Notes
	var_Notes.Add("1S",oG2antt.Items.FirstVisibleItem,"1","Start")
	var_Notes.Add("1F",oG2antt.Items.FirstVisibleItem,"1","End").RelativePosition = 1
oG2antt.EndUpdate()
|
|
983
|
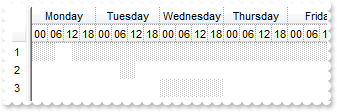
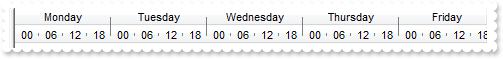
Is it possible to define different working hours for every week day
OleObject oG2antt,var_Chart,var_Items,var_Level,var_Level1
any h

oG2antt = ole_1.Object
oG2antt.BeginUpdate()
var_Chart = oG2antt.Chart
	var_Chart.PaneWidth(false,14)
	var_Chart.NonworkingDays = 0
	var_Chart.NonworkingHours = 0
	var_Chart.FirstVisibleDate = 2001-01-01
	var_Chart.LevelCount = 2
	var_Level = var_Chart.Level(0)
		var_Level.Alignment = 1
		var_Level.Label = "<%dddd%>"
	var_Level1 = var_Chart.Level(1)
		var_Level1.Label = "<%hh%>"
		var_Level1.Count = 6
	var_Chart.UnitWidth = 16
oG2antt.Columns.Add("")
var_Items = oG2antt.Items
	h = var_Items.AddItem(1)
	var_Items.ItemNonworkingUnits(h,false,"weekday(value) != 1 or (weekday(value) = 1 and not ( hour(value) >= 9 and hour(value) <= 14 ))")
	h = var_Items.AddItem(2)
	var_Items.ItemNonworkingUnits(h,false,"weekday(value) = 2 and ( hour(value) >= 9 and hour(value) <= 14 )")
	h = var_Items.AddItem(3)
	var_Items.ItemNonworkingUnits(h,false,"weekday(value) = 3")
oG2antt.EndUpdate()
|
|
982
|
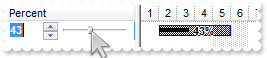
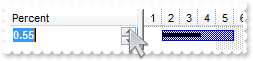
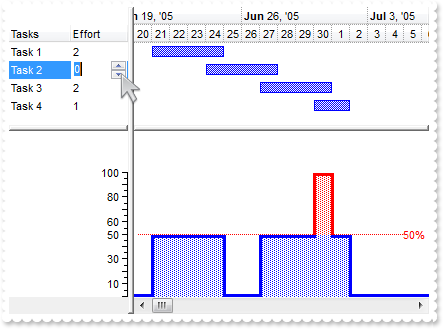
How can I automatically update the exBarPercent value using a slider control
OleObject oG2antt,var_Chart,var_Column,var_Items
any i

oG2antt = ole_1.Object
oG2antt.BeginUpdate()
oG2antt.Items.AllowCellValueToItemBar = true
var_Chart = oG2antt.Chart
	var_Chart.FirstVisibleDate = 2002-01-01
	var_Chart.PaneWidth(false,128)
	var_Chart.Bars.Add("Task%Progress").Shortcut = "Percent"
var_Column = oG2antt.Columns.Add("Percent")
	var_Column.Def(18,518)
	var_Column.Def(19,"P")
var_Items = oG2antt.Items
	i = var_Items.AddItem(0)
	var_Items.CellBold(i,0,true)
	var_Items.CellEditor(i,0).EditType = 20
	var_Items.AddBar(i,"Percent",2002-01-02,2002-01-06,"P")
	var_Items.ItemBar(i,"P",14,true)
	var_Items.CellValue(i,0,50)
oG2antt.EndUpdate()
|
|
981
|
Is there any automatic way to change a property for all bars in the chart
OleObject oG2antt,var_Items

oG2antt = ole_1.Object
oG2antt.Columns.Add("Task")
oG2antt.Chart.FirstVisibleDate = 2001-01-01
var_Items = oG2antt.Items
	var_Items.AddBar(var_Items.AddItem("Task 1"),"Task",2001-01-02,2001-01-04,"K1")
	var_Items.AddBar(var_Items.AddItem("Task 2"),"Task",2001-01-02,2001-01-04,"K2")
	var_Items.AddBar(var_Items.AddItem("Task 3"),"Task",2001-01-02,2001-01-04,"K3")
	var_Items.AddBar(var_Items.AddItem("Task 4"),"Task",2001-01-02,2001-01-04,"K4")
	var_Items.ItemBar(0,"<*>",33,255)
|
|
980
|
How can I assign an icon to a bar and I get notified when I click it
OleObject oG2antt,var_Items
any h

oG2antt = ole_1.Object
oG2antt.BeginUpdate()
oG2antt.Images("gBJJgBAIDAAGAAEAAQhYAf8Pf4hh0QihCJo2AEZjQAjEZFEaIEaEEaAIAkcbk0olUrlktl0vmExmUzmk1m03nE5nU7nk9n0/oFBoVDolFo1HpFJpVLplNp1PqFRqVTqlVq1XrFZrVbrldr1fsFhsVjslls1ntFptVrtltt1vuFxuVzul1u13vF5vV7vl9v1/wGBwWDwmFw2HxGJxWLxmNx0xiFdyOTh8Tf9ZymXx+QytcyNgz8r0OblWjyWds+m0ka1Vf1ta1+r1mos2xrG2xeZ0+a0W0qOx3GO4NV3WeyvD2XJ5XL5nN51aiw+lfSj0gkUkAEllHanHI5j/cHg8EZf7w8vl8j4f/qfEZeB09/vjLAB30+kZQAP/P5/H6/yNAOAEAwCjMBwFAEDwJBMDwLBYAP2/8Hv8/gAGAD8LQs9w/nhDY/oygIA=")
oG2antt.Columns.Add("Task")
oG2antt.Chart.FirstVisibleDate = 2001-01-01
oG2antt.Chart.PaneWidth(false,96)
var_Items = oG2antt.Items
	h = var_Items.AddItem("Task")
	var_Items.AddBar(h,"Task",2001-01-05,2001-01-10,"","Caption")
	var_Items.ItemBar(h,"",44,"<a1><img>1:8</img></a><a1><img>2</img></a>")
	var_Items.ItemBar(h,"",45,16)
	var_Items.ItemBar(h,"",47,5)
oG2antt.EndUpdate()
|
|
979
|
How can I assign an icon to a bar so I do not break its caption
OleObject oG2antt,var_Items
any h

oG2antt = ole_1.Object
oG2antt.BeginUpdate()
oG2antt.Images("gBJJgBAIDAAGAAEAAQhYAf8Pf4hh0QihCJo2AEZjQAjEZFEaIEaEEaAIAkcbk0olUrlktl0vmExmUzmk1m03nE5nU7nk9n0/oFBoVDolFo1HpFJpVLplNp1PqFRqVTqlVq1XrFZrVbrldr1fsFhsVjslls1ntFptVrtltt1vuFxuVzul1u13vF5vV7vl9v1/wGBwWDwmFw2HxGJxWLxmNx0xiFdyOTh8Tf9ZymXx+QytcyNgz8r0OblWjyWds+m0ka1Vf1ta1+r1mos2xrG2xeZ0+a0W0qOx3GO4NV3WeyvD2XJ5XL5nN51aiw+lfSj0gkUkAEllHanHI5j/cHg8EZf7w8vl8j4f/qfEZeB09/vjLAB30+kZQAP/P5/H6/yNAOAEAwCjMBwFAEDwJBMDwLBYAP2/8Hv8/gAGAD8LQs9w/nhDY/oygIA=")
oG2antt.Columns.Add("Task")
oG2antt.Chart.FirstVisibleDate = 2001-01-01
oG2antt.Chart.PaneWidth(false,96)
var_Items = oG2antt.Items
	h = var_Items.AddItem("Task")
	var_Items.AddBar(h,"Task",2001-01-05,2001-01-10,"","Caption")
	var_Items.ItemBar(h,"",44,"<img>1</img>")
	var_Items.ItemBar(h,"",45,16)
	var_Items.ItemBar(h,"",47,5)
	var_Items.ItemBar(h,"",48,2)
oG2antt.EndUpdate()
|
|
978
|
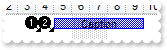
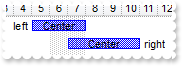
How can I assign multiple lables to the same bar
OleObject oG2antt,var_Items
any h1

oG2antt = ole_1.Object
oG2antt.BeginUpdate()
oG2antt.Columns.Add("Task")
oG2antt.Chart.FirstVisibleDate = 2001-01-01
oG2antt.Chart.PaneWidth(false,96)
var_Items = oG2antt.Items
	h1 = var_Items.AddItem("Task 1")
	var_Items.AddBar(h1,"Task",2001-01-05,2001-01-07,"","Right")
	var_Items.ItemBar(h1,"",4,18)
	var_Items.AddBar(h1,"",2001-01-05,2001-01-05,"T1","Left")
	var_Items.ItemBar(h1,"T1",4,16)
	var_Items.AddBar(h1,"",2001-01-05,2001-01-07,"T2","Center")
	var_Items.GroupBars(h1,"",true,h1,"T1",true)
	var_Items.GroupBars(h1,"",true,h1,"T1",false)
	var_Items.GroupBars(h1,"",true,h1,"T2",true)
	var_Items.GroupBars(h1,"",false,h1,"T2",false)
oG2antt.EndUpdate()
|
|
977
|
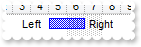
Is there any way to have more Captions on a bar than one
OleObject oG2antt,var_Items
any h1

oG2antt = ole_1.Object
oG2antt.BeginUpdate()
oG2antt.Columns.Add("Task")
oG2antt.Chart.FirstVisibleDate = 2001-01-01
oG2antt.Chart.PaneWidth(false,96)
var_Items = oG2antt.Items
	h1 = var_Items.AddItem("Task 1")
	var_Items.AddBar(h1,"Task",2001-01-05,2001-01-07,"","Right")
	var_Items.ItemBar(h1,"",4,18)
	var_Items.AddBar(h1,"",2001-01-05,2001-01-05,"T1","Left")
	var_Items.ItemBar(h1,"T1",4,16)
	var_Items.GroupBars(h1,"",true,h1,"T1",true)
	var_Items.GroupBars(h1,"",true,h1,"T1",false)
oG2antt.EndUpdate()
|
|
976
|
How can I assign multiple lables to the same bar at once
OleObject oG2antt,var_Items
any h

oG2antt = ole_1.Object
oG2antt.BeginUpdate()
oG2antt.Columns.Add("Task")
oG2antt.Chart.FirstVisibleDate = 2001-01-01
oG2antt.Chart.PaneWidth(false,96)
var_Items = oG2antt.Items
	h = var_Items.AddItem("Task 1")
	var_Items.AddBar(h,"Task",2001-01-05,2001-01-08,"","Center")
	var_Items.ItemBar(h,"",44,"left")
	var_Items.ItemBar(h,"",45,16)
	h = var_Items.AddItem("Task 2")
	var_Items.AddBar(h,"Task",2001-01-07,2001-01-11,"","Center")
	var_Items.ItemBar(h,"",44,"right")
	var_Items.ItemBar(h,"",45,18)
oG2antt.EndUpdate()
|
|
975
|
How can I limit the duration or length of the bar
OleObject oG2antt,var_Items
any h

oG2antt = ole_1.Object
oG2antt.BeginUpdate()
oG2antt.Chart.FirstVisibleDate = 2001-01-01
oG2antt.Chart.ScrollRange(0,2001-01-01)
oG2antt.Chart.ScrollRange(1,2001-01-07)
oG2antt.Chart.PaneWidth(false,128)
oG2antt.Columns.Add("Column")
var_Items = oG2antt.Items
	h = var_Items.AddItem("Item 1")
	var_Items.AddBar(h,"Task",2001-01-02,2001-01-05)
	var_Items.ItemBar(h,"",36,2)
	var_Items.ItemBar(h,"",37,5)
	var_Items.ItemBar(h,"",3,"Min=2 / Max=5")
	var_Items.ItemBar(h,"",4,18)
oG2antt.EndUpdate()
|
|
974
|
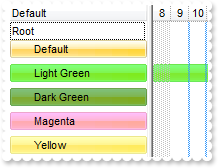
I have an EBN file how can I apply different colors to it, so no need to create a new one
OleObject oG2antt,var_Items
any h,hC

oG2antt = ole_1.Object
oG2antt.VisualAppearance.Add(1,"c:\exontrol\images\normal.ebn")
oG2antt.SelBackColor = oG2antt.BackColor
oG2antt.SelForeColor = oG2antt.ForeColor
oG2antt.HasLines = 0
oG2antt.Columns.Add("Default")
var_Items = oG2antt.Items
	h = var_Items.AddItem("Root")
	hC = var_Items.InsertItem(h,,"Default")
	var_Items.ItemBackColor(hC,16777216 /*0x1000000*/)
	var_Items.ItemHeight(var_Items.InsertItem(h,,""),6)
	hC = var_Items.InsertItem(h,,"Light Green")
	var_Items.ItemBackColor(hC,16842496 /*0x100ff00*/)
	oG2antt.Chart.ItemBackColor(hC,16842496 /*0x100ff00*/)
	var_Items.ItemHeight(var_Items.InsertItem(h,,""),6)
	hC = var_Items.InsertItem(h,,"Dark Green")
	var_Items.ItemBackColor(hC,16809728 /*0x1007f00*/)
	var_Items.ItemHeight(var_Items.InsertItem(h,,""),6)
	hC = var_Items.InsertItem(h,,"Magenta")
	var_Items.ItemBackColor(hC,33521663 /*0x1ff7fff*/)
	var_Items.ItemHeight(var_Items.InsertItem(h,,""),6)
	hC = var_Items.InsertItem(h,,"Yellow")
	var_Items.ItemBackColor(hC,25165823 /*0x17fffff*/)
	var_Items.ItemHeight(var_Items.InsertItem(h,,""),6)
	var_Items.ExpandItem(h,true)
|
|
973
|
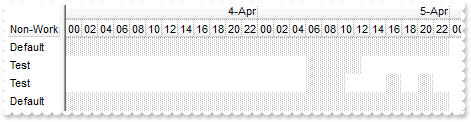
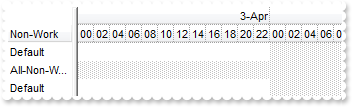
I need to specify the non-working hours for about 100 days for each item, but the scrolling is very slow. Is there any option to increase the speed
OleObject oG2antt,var_Chart,var_Items,var_Level,var_Level1

oG2antt = ole_1.Object
oG2antt.BeginUpdate()
oG2antt.AllowChartScrollPage = true
oG2antt.Columns.Add("Non-Work")
var_Chart = oG2antt.Chart
	var_Chart.FirstVisibleDate = DateTime(2009-04-04,16:00:00)
	var_Chart.PaneWidth(false,52)
	var_Chart.LevelCount = 2
	var_Chart.UnitWidth = 16
	var_Level = var_Chart.Level(0)
		var_Level.Label = "<r><%d%>-<%mmm%>"
		var_Level.Unit = 4096
	var_Level1 = var_Chart.Level(1)
		var_Level1.Label = "<%hh%>"
		var_Level1.Unit = 65536
		var_Level1.Count = 2
var_Items = oG2antt.Items
	var_Items.AddItem("Default")
	var_Items.ItemNonworkingUnits(var_Items.AddItem("Test"),false,"date(shortdate(value)) case(default:0;#4/5/2009# : hour(value) >= 6 and hour(value) <= 12; #4/6/2009# : hour(value) >= 6 and hour(value) <= 12; #4/7/2009# : hour(value) >= 6 and hour(value) <= 12; #4/8/2009# : hour(value) >= 6 and hour(value) <= 12; #4/9/2009# : hour(value) >= 6 and hour(value) <= 12; #4/10/2009# : hour(value) >= 6 and hour(value) <= 12; #4/11/2009# : hour(value) >= 6 and hour(value) <= 12; #4/12/2009# : hour(value) >= 6 and hour(value) <= 12; #4/13/2009# : hour(value) >= 6 and hour(value) <= 12; #4/14/2009# : hour(value) >= 6 and hour(value) <= 12; #4/15/2009# : hour(value) >= 6 and hour(value) <= 12; #4/16/2009# : hour(value) >= 6 and hour(value) <= 12; #4/17/2009# : hour(value) >= 6 and hour(value) <= 12; #4/18/2009# : hour(value) >= 6 and hour(value) <= 12; #4/19/2009# : hour(value) >= 6 and hour(value) <= 12; #4/20/2009# : hour(value) >= 6 and hour(value) <= 12; #4/21/2009# : hour(value) >= 6 and hour(value) <= 12; #4/22/2009# : hour(value) >= 6 and hour(value) <= 12; #4/23/2009# : hour" &
	 +"(value) >= 6 and hour(value) <= 12; #4/24/2009# : hour(value) >= 6 and hour(value) <= 12; #4/25/2009# : hour(value) >= 6 and hour(value) <= 12; #4/26/2009# : hour(value) >= 6 and hour(value) <= 12; #4/27/2009# : hour(value) >= 6 and hour(value) <= 12; #4/28/2009# : hour(value) >= 6 and hour(value) <= 12; #4/29/2009# : hour(value) >= 6 and hour(value) <= 12; #4/30/2009# : hour(value) >= 6 and hour(value) <= 12; #5/1/2009# : hour(value) >= 6 and hour(value) <= 12; #5/2/2009# : hour(value) >= 6 and hour(value) <= 12; #5/3/2009# : hour(value) >= 6 and hour(value) <= 12; #5/4/2009# : hour(value) >= 6 and hour(value) <= 12; #5/5/2009# : hour(value) >= 6 and hour(value) <= 12; #5/6/2009# : hour(value) >= 6 and hour(value) <= 12; #5/7/2009# : hour(value) >= 6 and hour(value) <= 12; #5/8/2009# : hour(value) >= 6 and hour(value) <= 12; #5/9/2009# : hour(value) >= 6 and hour(value) <= 12; #5/10/2009# : hour(value) >= 6 and hour(value) <= 12; #5/11/2009# : hour(value) >= 6 and hour(value) <= 12; #5/13/2009# : hour(value)" &
	 +" >= 6 and hour(value) <= 12; #5/14/2009# : hour(value) >= 6 and hour(value) <= 12; #5/15/2009# : hour(value) >= 6 and hour(value) <= 12; #5/16/2009# : hour(value) >= 6 and hour(value) <= 12; #5/17/2009# : hour(value) >= 6 and hour(value) <= 12; #5/18/2009# : hour(value) >= 6 and hour(value) <= 12; #5/19/2009# : hour(value) >= 6 and hour(value) <= 12; #5/20/2009# : hour(value) >= 6 and hour(value) <= 12; #5/21/2009# : hour(value) >= 6 and hour(value) <= 12; #5/22/2009# : hour(value) >= 6 and hour(value) <= 12; #5/23/2009# : hour(value) >= 6 and hour(value) <= 12; #5/24/2009# : hour(value) >= 6 and hour(value) <= 12; #5/25/2009# : hour(value) >= 6 and hour(value) <= 12; #5/26/2009# : hour(value) >= 6 and hour(value) <= 12; #5/27/2009# : hour(value) >= 6 and hour(value) <= 12; #5/28/2009# : hour(value) >= 6 and hour(value) <= 12; #5/29/2009# : hour(value) >= 6 and hour(value) <= 12; #5/30/2009# : hour(value) >= 6 and hour(value) <= 12; #5/31/2009# : hour(value) >= 6 and hour(value) <= 12; #6/1/2009# : hour(value" &
	 +") >= 6 and hour(value) <= 12; #6/2/2009# : hour(value) >= 6 and hour(value) <= 12; #6/3/2009# : hour(value) >= 6 and hour(value) <= 12; #6/4/2009# : hour(value) >= 6 and hour(value) <= 12; #6/5/2009# : hour(value) >= 6 and hour(value) <= 12; #6/6/2009# : hour(value) >= 6 and hour(value) <= 12; #6/7/2009# : hour(value) >= 6 and hour(value) <= 12; #6/8/2009# : hour(value) >= 6 and hour(value) <= 12; #6/9/2009# : hour(value) >= 6 and hour(value) <= 12; #6/10/2009# : hour(value) >= 6 and hour(value) <= 12; #6/11/2009# : hour(value) >= 6 and hour(value) <= 12; #6/12/2009# : hour(value) >= 6 and hour(value) <= 12; #6/13/2009# : hour(value) >= 6 and hour(value) <= 12; #6/14/2009# : hour(value) >= 6 and hour(value) <= 12; #6/15/2009# : hour(value) >= 6 and hour(value) <= 12; #6/16/2009# : hour(value) >= 6 and hour(value) <= 12; #6/17/2009# : hour(value) >= 6 and hour(value) <= 12; #6/18/2009# : hour(value) >= 6 and hour(value) <= 12; #6/19/2009# : hour(value) >= 6 and hour(value) <= 12; #6/21/2009# : hour(value) >= 6" &
	 +" and hour(value) <= 12; #6/22/2009# : hour(value) >= 6 and hour(value) <= 12; #6/23/2009# : hour(value) >= 6 and hour(value) <= 12; #6/24/2009# : hour(value) >= 6 and hour(value) <= 12; #6/25/2009# : hour(value) >= 6 and hour(value) <= 12; #6/26/2009# : hour(value) >= 6 and hour(value) <= 12; #6/27/2009# : hour(value) >= 6 and hour(value) <= 12; #6/28/2009# : hour(value) >= 6 and hour(value) <= 12; #6/29/2009# : hour(value) >= 6 and hour(value) <= 12; #6/30/2009# : hour(value) >= 6 and hour(value) <= 12; #7/1/2009# : hour(value) >= 6 and hour(value) <= 12; #7/2/2009# : hour(value) >= 6 and hour(value) <= 12; #7/3/2009# : hour(value) >= 6 and hour(value) <= 12; #7/4/2009# : hour(value) >= 6 and hour(value) <= 12; #7/5/2009# : hour(value) >= 6 and hour(value) <= 12; #7/6/2009# : hour(value) >= 6 and hour(value) <= 12; #7/7/2009# : hour(value) >= 6 and hour(value) <= 12; #7/8/2009# : hour(value) >= 6 and hour(value) <= 12; #7/9/2009# : hour(value) >= 6 and hour(value) <= 12; #7/10/2009# : hour(value) >= 6 and ho" &
	 +"ur(value) <= 12; #7/11/2009# : hour(value) >= 6 and hour(value) <= 12; #7/12/2009# : hour(value) >= 6 and hour(value) <= 12; #7/13/2009# : hour(value) >= 6 and hour(value) <= 12; #7/14/2009# : hour(value) >= 6 and hour(value) <= 12)")
	var_Items.ItemNonworkingUnits(var_Items.AddItem("Test"),false,"date(shortdate(value)) case(default:0;#4/5/2009# : hour(value) >= 6 and hour(value) <= 10 or hour(value) in (16,17,20,21); #4/6/2009# : hour(value) >= 6 and hour(value) <= 10 or hour(value) in (16,17,20,21); #4/7/2009# : hour(value) >= 6 and hour(value) <= 10 or hour(value) in (16,17,20,21); #4/8/2009# : hour(value) >= 6 and hour(value) <= 10 or hour(value) in (16,17,20,21); #4/9/2009# : hour(value) >= 6 and hour(value) <= 10 or hour(value) in (16,17,20,21); #4/10/2009# : hour(value) >= 6 and hour(value) <= 10 or hour(value) in (16,17,20,21); #4/11/2009# : hour(value) >= 6 and hour(value) <= 10 or hour(value) in (16,17,20,21); #4/12/2009# : hour(value) >= 6 and hour(value) <= 10 or hour(value) in (16,17,20,21); #4/13/2009# : hour(value) >= 6 and hour(value) <= 10 or hour(value) in (16,17,20,21); #4/14/2009# : hour(value) >= 6 and hour(value) <= 10 or hour(value) in (16,17,20,21); #4/15/2009# : hour(value) >= 6 and hour(value) <= 10 or hour(value) in (16,17,20,21); #4/16/2009# : hour(value) >= 6 and hour(valu" &
	 +"e) <= 10 or hour(value) in (16,17,20,21); #4/17/2009# : hour(value) >= 6 and hour(value) <= 10 or hour(value) in (16,17,20,21); #4/18/2009# : hour(value) >= 6 and hour(value) <= 10 or hour(value) in (16,17,20,21); #4/19/2009# : hour(value) >= 6 and hour(value) <= 10 or hour(value) in (16,17,20,21); #4/20/2009# : hour(value) >= 6 and hour(value) <= 10 or hour(value) in (16,17,20,21); #4/21/2009# : hour(value) >= 6 and hour(value) <= 10 or hour(value) in (16,17,20,21); #4/22/2009# : hour(value) >= 6 and hour(value) <= 10 or hour(value) in (16,17,20,21); #4/23/2009# : hour(value) >= 6 and hour(value) <= 10 or hour(value) in (16,17,20,21); #4/24/2009# : hour(value) >= 6 and hour(value) <= 10 or hour(value) in (16,17,20,21); #4/25/2009# : hour(value) >= 6 and hour(value) <= 10 or hour(value) in (16,17,20,21); #4/26/2009# : hour(value) >= 6 and hour(value) <= 10 or hour(value) in (16,17,20,21); #4/27/2009# : hour(value) >= 6 and hour(value) <= 10 or hour(value) in (16,17,20,21); #4/28/2009# : hour(value) >= 6 and h" &
	 +"our(value) <= 10 or hour(value) in (16,17,20,21); #4/29/2009# : hour(value) >= 6 and hour(value) <= 10 or hour(value) in (16,17,20,21); #4/30/2009# : hour(value) >= 6 and hour(value) <= 10 or hour(value) in (16,17,20,21); #5/1/2009# : hour(value) >= 6 and hour(value) <= 10 or hour(value) in (16,17,20,21); #5/2/2009# : hour(value) >= 6 and hour(value) <= 10 or hour(value) in (16,17,20,21); #5/3/2009# : hour(value) >= 6 and hour(value) <= 10 or hour(value) in (16,17,20,21); #5/4/2009# : hour(value) >= 6 and hour(value) <= 10 or hour(value) in (16,17,20,21); #5/5/2009# : hour(value) >= 6 and hour(value) <= 10 or hour(value) in (16,17,20,21); #5/6/2009# : hour(value) >= 6 and hour(value) <= 10 or hour(value) in (16,17,20,21); #5/7/2009# : hour(value) >= 6 and hour(value) <= 10 or hour(value) in (16,17,20,21); #5/8/2009# : hour(value) >= 6 and hour(value) <= 10 or hour(value) in (16,17,20,21); #5/9/2009# : hour(value) >= 6 and hour(value) <= 10 or hour(value) in (16,17,20,21); #5/10/2009# : hour(value) >= 6 and ho" &
	 +"ur(value) <= 10 or hour(value) in (16,17,20,21); #5/11/2009# : hour(value) >= 6 and hour(value) <= 10 or hour(value) in (16,17,20,21); #5/13/2009# : hour(value) >= 6 and hour(value) <= 10 or hour(value) in (16,17,20,21); #5/14/2009# : hour(value) >= 6 and hour(value) <= 10 or hour(value) in (16,17,20,21); #5/15/2009# : hour(value) >= 6 and hour(value) <= 10 or hour(value) in (16,17,20,21); #5/16/2009# : hour(value) >= 6 and hour(value) <= 10 or hour(value) in (16,17,20,21); #5/17/2009# : hour(value) >= 6 and hour(value) <= 10 or hour(value) in (16,17,20,21); #5/18/2009# : hour(value) >= 6 and hour(value) <= 10 or hour(value) in (16,17,20,21); #5/19/2009# : hour(value) >= 6 and hour(value) <= 10 or hour(value) in (16,17,20,21); #5/20/2009# : hour(value) >= 6 and hour(value) <= 10 or hour(value) in (16,17,20,21); #5/21/2009# : hour(value) >= 6 and hour(value) <= 10 or hour(value) in (16,17,20,21); #5/22/2009# : hour(value) >= 6 and hour(value) <= 10 or hour(value) in (16,17,20,21); #5/23/2009# : hour(value) >= " &
	 +"6 and hour(value) <= 10 or hour(value) in (16,17,20,21); #5/24/2009# : hour(value) >= 6 and hour(value) <= 10 or hour(value) in (16,17,20,21); #5/25/2009# : hour(value) >= 6 and hour(value) <= 10 or hour(value) in (16,17,20,21); #5/26/2009# : hour(value) >= 6 and hour(value) <= 10 or hour(value) in (16,17,20,21); #5/27/2009# : hour(value) >= 6 and hour(value) <= 10 or hour(value) in (16,17,20,21); #5/28/2009# : hour(value) >= 6 and hour(value) <= 10 or hour(value) in (16,17,20,21); #5/29/2009# : hour(value) >= 6 and hour(value) <= 10 or hour(value) in (16,17,20,21); #5/30/2009# : hour(value) >= 6 and hour(value) <= 10 or hour(value) in (16,17,20,21); #5/31/2009# : hour(value) >= 6 and hour(value) <= 10 or hour(value) in (16,17,20,21); #6/1/2009# : hour(value) >= 6 and hour(value) <= 10 or hour(value) in (16,17,20,21); #6/2/2009# : hour(value) >= 6 and hour(value) <= 10 or hour(value) in (16,17,20,21); #6/3/2009# : hour(value) >= 6 and hour(value) <= 10 or hour(value) in (16,17,20,21); #6/4/2009# : hour(value)" &
	 +" >= 6 and hour(value) <= 10 or hour(value) in (16,17,20,21); #6/5/2009# : hour(value) >= 6 and hour(value) <= 10 or hour(value) in (16,17,20,21); #6/6/2009# : hour(value) >= 6 and hour(value) <= 10 or hour(value) in (16,17,20,21); #6/7/2009# : hour(value) >= 6 and hour(value) <= 10 or hour(value) in (16,17,20,21); #6/8/2009# : hour(value) >= 6 and hour(value) <= 10 or hour(value) in (16,17,20,21); #6/9/2009# : hour(value) >= 6 and hour(value) <= 10 or hour(value) in (16,17,20,21); #6/10/2009# : hour(value) >= 6 and hour(value) <= 10 or hour(value) in (16,17,20,21); #6/11/2009# : hour(value) >= 6 and hour(value) <= 10 or hour(value) in (16,17,20,21); #6/12/2009# : hour(value) >= 6 and hour(value) <= 10 or hour(value) in (16,17,20,21); #6/13/2009# : hour(value) >= 6 and hour(value) <= 10 or hour(value) in (16,17,20,21); #6/14/2009# : hour(value) >= 6 and hour(value) <= 10 or hour(value) in (16,17,20,21); #6/15/2009# : hour(value) >= 6 and hour(value) <= 10 or hour(value) in (16,17,20,21); #6/16/2009# : hour(val" &
	 +"ue) >= 6 and hour(value) <= 10 or hour(value) in (16,17,20,21); #6/17/2009# : hour(value) >= 6 and hour(value) <= 10 or hour(value) in (16,17,20,21); #6/18/2009# : hour(value) >= 6 and hour(value) <= 10 or hour(value) in (16,17,20,21); #6/19/2009# : hour(value) >= 6 and hour(value) <= 10 or hour(value) in (16,17,20,21); #6/21/2009# : hour(value) >= 6 and hour(value) <= 10 or hour(value) in (16,17,20,21); #6/22/2009# : hour(value) >= 6 and hour(value) <= 10 or hour(value) in (16,17,20,21); #6/23/2009# : hour(value) >= 6 and hour(value) <= 10 or hour(value) in (16,17,20,21); #6/24/2009# : hour(value) >= 6 and hour(value) <= 10 or hour(value) in (16,17,20,21); #6/25/2009# : hour(value) >= 6 and hour(value) <= 10 or hour(value) in (16,17,20,21); #6/26/2009# : hour(value) >= 6 and hour(value) <= 10 or hour(value) in (16,17,20,21); #6/27/2009# : hour(value) >= 6 and hour(value) <= 10 or hour(value) in (16,17,20,21); #6/28/2009# : hour(value) >= 6 and hour(value) <= 10 or hour(value) in (16,17,20,21); #6/29/2009# : " &
	 +"hour(value) >= 6 and hour(value) <= 10 or hour(value) in (16,17,20,21); #6/30/2009# : hour(value) >= 6 and hour(value) <= 10 or hour(value) in (16,17,20,21); #7/1/2009# : hour(value) >= 6 and hour(value) <= 10 or hour(value) in (16,17,20,21); #7/2/2009# : hour(value) >= 6 and hour(value) <= 10 or hour(value) in (16,17,20,21); #7/3/2009# : hour(value) >= 6 and hour(value) <= 10 or hour(value) in (16,17,20,21); #7/4/2009# : hour(value) >= 6 and hour(value) <= 10 or hour(value) in (16,17,20,21); #7/5/2009# : hour(value) >= 6 and hour(value) <= 10 or hour(value) in (16,17,20,21); #7/6/2009# : hour(value) >= 6 and hour(value) <= 10 or hour(value) in (16,17,20,21); #7/7/2009# : hour(value) >= 6 and hour(value) <= 10 or hour(value) in (16,17,20,21); #7/8/2009# : hour(value) >= 6 and hour(value) <= 10 or hour(value) in (16,17,20,21); #7/9/2009# : hour(value) >= 6 and hour(value) <= 10 or hour(value) in (16,17,20,21); #7/10/2009# : hour(value) >= 6 and hour(value) <= 10 or hour(value) in (16,17,20,21); #7/11/2009# : h" &
	 +"our(value) >= 6 and hour(value) <= 10 or hour(value) in (16,17,20,21); #7/12/2009# : hour(value) >= 6 and hour(value) <= 10 or hour(value) in (16,17,20,21); #7/13/2009# : hour(value) >= 6 and hour(value) <= 10 or hour(value) in (16,17,20,21); #7/14/2009# : hour(value) >= 6 and hour(value) <= 10 or hour(value) in (16,17,20,21))")
	var_Items.AddItem("Default")
oG2antt.EndUpdate()
|
|
972
|
How can I use the CASE statement (CASE usage)
OleObject oG2antt,var_Column,var_Column1,var_Items

oG2antt = ole_1.Object
oG2antt.BeginUpdate()
var_Column = oG2antt.Columns.Add("Value")
	var_Column.Width = 24
	var_Column.Editor.EditType = 4
var_Column1 = oG2antt.Columns.Add("CASE - statment")
	var_Column1.ComputedField = "%0 case (default:'not found';1:%0;2:2*%0;3:3*%0;4:4*%0;5:5*%0;7:'Seven';8:'Eight';9:'Nine';11:'Eleven';13:'Thirtheen';14:'Fourtheen')"
	var_Column1.ToolTip = var_Column1.ComputedField
var_Items = oG2antt.Items
	var_Items.AddItem(0)
	var_Items.AddItem(1)
	var_Items.AddItem(2)
oG2antt.EndUpdate()
|
|
971
|
How can I use the CASE statement (CASE usage)
OleObject oG2antt,var_Column,var_Column1,var_Items

oG2antt = ole_1.Object
oG2antt.BeginUpdate()
var_Column = oG2antt.Columns.Add("Value")
	var_Column.Width = 24
	var_Column.Editor.EditType = 4
var_Column1 = oG2antt.Columns.Add("CASE - statment")
	var_Column1.ComputedField = "%0 case (default:'not found';1:'One';2:'Two';3:'Three';4:'Four';5:'Five';7:'Seven';8:'Eight';9:'Nine';11:'Eleven';13:'Thirtheen';14:'Fourtheen')"
	var_Column1.ToolTip = var_Column1.ComputedField
var_Items = oG2antt.Items
	var_Items.AddItem(0)
	var_Items.AddItem(1)
	var_Items.AddItem(2)
oG2antt.EndUpdate()
|
|
970
|
I have seen the IN function but it returns -1 or 0. How can I display the value being found ( SWITCH usage )
OleObject oG2antt,var_Column,var_Column1,var_Items

oG2antt = ole_1.Object
oG2antt.BeginUpdate()
var_Column = oG2antt.Columns.Add("Value")
	var_Column.Width = 24
	var_Column.Editor.EditType = 4
var_Column1 = oG2antt.Columns.Add("SWITCH - statment")
	var_Column1.ComputedField = "%0 switch ('not found', 1,2,3,4,5,7,8,9,11,13,14)"
	var_Column1.ToolTip = var_Column1.ComputedField
var_Items = oG2antt.Items
	var_Items.AddItem(0)
	var_Items.AddItem(1)
	var_Items.AddItem(2)
oG2antt.EndUpdate()
|
|
969
|
I have a large collection of constant values and using or operator is a time consuming (IN usage). Is there any way to increase the speed to check if a value maches the collection
OleObject oG2antt,var_Column,var_Column1,var_Items

oG2antt = ole_1.Object
oG2antt.BeginUpdate()
var_Column = oG2antt.Columns.Add("Value")
	var_Column.Width = 24
	var_Column.Editor.EditType = 4
var_Column1 = oG2antt.Columns.Add("IN - statment")
	var_Column1.ComputedField = "%0 in (1,2,3,4,5,7,8,9,11,13,14) ? 'found' : ''"
	var_Column1.ToolTip = var_Column1.ComputedField
var_Items = oG2antt.Items
	var_Items.AddItem(0)
	var_Items.AddItem(1)
	var_Items.AddItem(2)
oG2antt.EndUpdate()
|
|
968
|
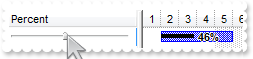
How can I automatically update the exBarPercent value using a slider control
OleObject oG2antt,var_Chart,var_Column,var_Editor,var_Items
any i

oG2antt = ole_1.Object
oG2antt.BeginUpdate()
oG2antt.Items.AllowCellValueToItemBar = true
var_Chart = oG2antt.Chart
	var_Chart.FirstVisibleDate = 2002-01-01
	var_Chart.PaneWidth(false,128)
	var_Chart.Bars.Add("Task%Progress").Shortcut = "Percent"
var_Column = oG2antt.Columns.Add("Percent")
	var_Column.Def(18,12)
	var_Column.Def(19,"P")
var_Items = oG2antt.Items
	i = var_Items.AddItem(0)
	var_Items.CellBold(i,0,true)
	var_Editor = var_Items.CellEditor(i,0)
		var_Editor.EditType = 20
		var_Editor.Option(42,0.01)
		var_Editor.Option(40,0.01)
		var_Editor.Option(44,1)
		var_Editor.Option(41,-100)
	var_Items.CellValueFormat(i,0,1)
	var_Items.AddBar(i,"Percent",2002-01-02,2002-01-06,"P")
	var_Items.ItemBar(i,"P",14,true)
	var_Items.CellValue(i,0,0.5)
oG2antt.EndUpdate()
|
|
967
|
How can I automatically update the exBarPercent value using a spin control
OleObject oG2antt,var_Chart,var_Column,var_Editor,var_Items
any i

oG2antt = ole_1.Object
oG2antt.BeginUpdate()
oG2antt.Items.AllowCellValueToItemBar = true
var_Chart = oG2antt.Chart
	var_Chart.FirstVisibleDate = 2002-01-01
	var_Chart.PaneWidth(false,128)
	var_Chart.Bars.Add("Task%Progress").Shortcut = "Percent"
var_Column = oG2antt.Columns.Add("Percent")
	var_Column.Def(18,12)
	var_Column.FormatColumn = "((0:=round(dbl(%0)*100)) >= 50 ? '<font 8>'+ =:0 + '%</font>' : '<fgcolor=808080><font 6>'+ =:0 + '%</font></fgcolor>')"
var_Items = oG2antt.Items
	i = var_Items.AddItem(0)
	var_Items.CellBold(i,0,true)
	var_Editor = var_Items.CellEditor(i,0)
		var_Editor.EditType = 4
		var_Editor.Option(40,0.01)
		var_Editor.Option(44,1)
	var_Items.CellValueFormat(i,0,1)
	var_Items.AddBar(i,"Percent",2002-01-02,2002-01-06)
	var_Items.CellValue(i,0,0.5)
oG2antt.EndUpdate()
|
|
966
|
How do I specify for an item all units as being non-working units
OleObject oG2antt,var_Chart,var_Items,var_Level,var_Level1

oG2antt = ole_1.Object
oG2antt.BeginUpdate()
oG2antt.AllowChartScrollPage = true
oG2antt.Columns.Add("Non-Work")
var_Chart = oG2antt.Chart
	var_Chart.AllowCreateBar = 1
	var_Chart.FirstVisibleDate = DateTime(2009-04-03,10:00:00)
	var_Chart.PaneWidth(false,64)
	var_Chart.LevelCount = 2
	var_Chart.UnitWidth = 16
	var_Level = var_Chart.Level(0)
		var_Level.Label = "<r><%d%>-<%mmm%>"
		var_Level.Unit = 4096
	var_Level1 = var_Chart.Level(1)
		var_Level1.Label = "<%hh%>"
		var_Level1.Unit = 65536
		var_Level1.Count = 2
var_Items = oG2antt.Items
	var_Items.AddItem("Default")
	var_Items.ItemNonworkingUnits(var_Items.AddItem("All-Non-Working"),false,"1")
	var_Items.AddItem("Default")
oG2antt.EndUpdate()
|
|
965
|
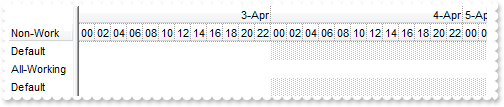
How do I specify for an item all units as being working units
OleObject oG2antt,var_Chart,var_Items,var_Level,var_Level1

oG2antt = ole_1.Object
oG2antt.BeginUpdate()
oG2antt.AllowChartScrollPage = true
oG2antt.Columns.Add("Non-Work")
var_Chart = oG2antt.Chart
	var_Chart.AllowCreateBar = 1
	var_Chart.FirstVisibleDate = DateTime(2009-04-03,10:00:00)
	var_Chart.PaneWidth(false,64)
	var_Chart.LevelCount = 2
	var_Chart.UnitWidth = 16
	var_Level = var_Chart.Level(0)
		var_Level.Label = "<r><%d%>-<%mmm%>"
		var_Level.Unit = 4096
	var_Level1 = var_Chart.Level(1)
		var_Level1.Label = "<%hh%>"
		var_Level1.Unit = 65536
		var_Level1.Count = 2
var_Items = oG2antt.Items
	var_Items.AddItem("Default")
	var_Items.ItemNonworkingUnits(var_Items.AddItem("All-Working"),false,"0")
	var_Items.AddItem("Default")
oG2antt.EndUpdate()
|
|
964
|
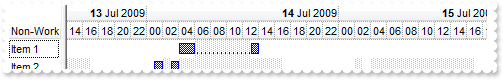
How can I programmatically specify different non-working units ( days, hours ) for different items
OleObject oG2antt,var_Chart,var_Items,var_Level,var_Level1
any h

oG2antt = ole_1.Object
oG2antt.BeginUpdate()
oG2antt.AllowChartScrollPage = true
oG2antt.Columns.Add("Non-Work")
var_Chart = oG2antt.Chart
	var_Chart.AllowCreateBar = 1
	var_Chart.Bars.Add("Task:Split").Shortcut = "Task"
	var_Chart.FirstVisibleDate = DateTime(2009-07-13,12:00:00)
	var_Chart.PaneWidth(false,52)
	var_Chart.LevelCount = 2
	var_Chart.UnitWidth = 16
	var_Level = var_Chart.Level(0)
		var_Level.Label = "<r><b><%d%></b> <%mmm%> <%yyyy%>"
		var_Level.Unit = 4096
	var_Level1 = var_Chart.Level(1)
		var_Level1.Label = "<%hh%>"
		var_Level1.Unit = 65536
		var_Level1.Count = 2
var_Items = oG2antt.Items
	h = var_Items.AddItem("Item 1")
	var_Items.ItemNonworkingUnits(h,false,"(shortdate(value) = #7/14/2009# and hour(value) >= 6 and hour(value) <= 12)")
	var_Items.AddBar(h,"Task",DateTime(2009-07-14,04:00:00),DateTime(2009-07-14,14:00:00))
	h = var_Items.AddItem("Item 2")
	var_Items.ItemNonworkingUnits(h,false,"(((hour(value) >= 4 and hour(value) <= 16) or hour(value) = 2) and month(value) = 7) or ((hour(value) >= 2 and hour(value) < 10)) and month(value) = 6 or weekday(value) = 6")
	var_Items.AddBar(h,"Task",DateTime(2009-07-14,01:00:00),DateTime(2009-07-14,06:00:00))
oG2antt.EndUpdate()
|
|
963
|
I am programmatically select a date using the Chart.SelectDate property, but can't see why the date is not highlighted. What am I doing wrong
OleObject oG2antt,var_Chart

oG2antt = ole_1.Object
var_Chart = oG2antt.Chart
	var_Chart.LevelCount = 2
	var_Chart.FirstVisibleDate = 2001-01-01
	var_Chart.SelectLevel = 1
	var_Chart.SelectDate(2001-01-04,true)
|
|
962
|
How do I show a shorter line in the chart's level
OleObject oG2antt,var_Chart,var_Level,var_Level1

oG2antt = ole_1.Object
oG2antt.BeginUpdate()
oG2antt.GridLineColor = RGB(128,128,128)
var_Chart = oG2antt.Chart
	var_Chart.DrawLevelSeparator = 0
	var_Chart.UnitWidth = 24
	var_Chart.FirstVisibleDate = 2001-01-01
	var_Chart.PaneWidth(false,0)
	var_Chart.LevelCount = 2
	var_Level = var_Chart.Level(0)
		var_Level.Alignment = 1
		var_Level.Label = "<%dddd%>"
		var_Level.DrawTickLines = 18 /*exLevelLowerHalf | exLevelSolidLine*/
	var_Level1 = var_Chart.Level(1)
		var_Level1.Label = 65536
		var_Level1.Count = 6
		var_Level1.DrawTickLines = 578 /*0x200 | exLevelMiddleLine | exLevelSolidLine*/
		var_Level1.DrawTickLinesFrom(0,34 /*exLevelUpperHalf | exLevelSolidLine*/)
oG2antt.EndUpdate()
|
|
961
|
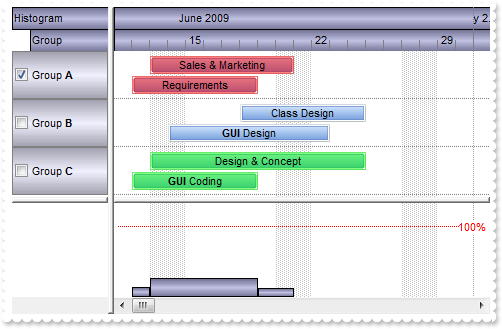
How do I replicate the screen shot http://www.exontrol.com/images/exg2antt9.jpg
OleObject oG2antt,var_Appearance,var_Bar,var_Chart,var_Column,var_Column1,var_Columns,var_Items,var_Level,var_Level1
any h

oG2antt = ole_1.Object
oG2antt.BeginUpdate()
var_Appearance = oG2antt.VisualAppearance
	var_Appearance.Add(1,"C:\Program Files\Exontrol\ExG2antt.NET\Sample\EBN\headdark.ebn")
	var_Appearance.Add(2,"C:\Program Files\Exontrol\ExG2antt.NET\Sample\EBN\xpbsel.ebn")
	var_Appearance.Add(3,"C:\Program Files\Exontrol\ExG2antt.NET\Sample\EBN\headligh.ebn")
	var_Appearance.Add(4,"CP:1 0 0 1 1")
oG2antt.BackColorHeader = 67108864 /*0x4000000*/
oG2antt.Chart.BackColorLevelHeader = 67108864 /*0x4000000*/
oG2antt.SelBackColor = 33554687 /*0x20000ff*/
oG2antt.GridLineColor = RGB(128,128,128)
oG2antt.HeaderHeight = 22
oG2antt.SelForeColor = RGB(0,0,0)
oG2antt.MarkSearchColumn = false
oG2antt.ScrollBySingleLine = false
oG2antt.ShowFocusRect = false
oG2antt.DefaultItemHeight = 48
var_Columns = oG2antt.Columns
	var_Column = var_Columns.Add("Group")
		var_Column.Def(0,true)
		var_Column.Def(4,50331648)
		var_Column.LevelKey = 1
	var_Column1 = var_Columns.Add("Histogram")
		var_Column1.Width = 18
		var_Column1.AllowSizing = false
		var_Column1.LevelKey = 1
		var_Column1.Position = 0
var_Chart = oG2antt.Chart
	var_Chart.FirstVisibleDate = 2009-06-11
	var_Chart.DrawGridLines = -1
	var_Chart.PaneWidth(false,96)
	var_Chart.LevelCount = 2
	var_Chart.DrawLevelSeparator = false
	var_Level = var_Chart.Level(0)
		var_Level.Label = "<%mmmm%> <%yyyy%>"
		var_Level.Unit = 16
		var_Level.Alignment = 1
	var_Level1 = var_Chart.Level(1)
		var_Level1.FormatLabel = "weekday(dvalue)=1?value:''"
		var_Level1.DrawTickLines = 18 /*exLevelLowerHalf | exLevelSolidLine*/
		var_Level1.DrawTickLinesFrom(0,2)
		var_Level1.Alignment = 1
	var_Bar = var_Chart.Bars.Item("Task")
		var_Bar.Color = 33554432 /*0x2000000*/
		var_Bar.Height = 18
		var_Bar.OverlaidType = 515 /*exOverlaidBarsStackAutoArrange | exOverlaidBarsStack*/
		var_Bar.HistogramColor = 16777216 /*0x1000000*/
		var_Bar.HistogramType = 1
	var_Chart.HistogramVisible = true
	var_Chart.HistogramHeight = 48
	var_Chart.HistogramView = 4
var_Items = oG2antt.Items
	h = var_Items.AddItem("Group <b>A</b>")
	var_Items.CellValueFormat(h,0,1)
	var_Items.CellMerge(h,0,1)
	var_Items.AddBar(h,"Task",2009-06-12,2009-06-19,"K1","Requirements")
	var_Items.AddBar(h,"Task",2009-06-13,2009-06-21,"K2","Sales & Marketing")
	var_Items.ItemBar(h,"K1",33,255)
	var_Items.ItemBar(h,"K2",33,255)
	var_Items.CellState(h,0,1)
	h = var_Items.AddItem("Group <b>B</b>")
	var_Items.CellValueFormat(h,0,1)
	var_Items.CellMerge(h,0,1)
	var_Items.AddBar(h,"Task",2009-06-14,2009-06-23,"K1","<b>GUI</b> Design")
	var_Items.AddBar(h,"Task",2009-06-18,2009-06-25,"K2","Class Design")
	h = var_Items.AddItem("Group <b>C</b>")
	var_Items.CellValueFormat(h,0,1)
	var_Items.CellMerge(h,0,1)
	var_Items.AddBar(h,"Task",2009-06-12,2009-06-19,"K1","<b>GUI</b> Coding")
	var_Items.AddBar(h,"Task",2009-06-13,2009-06-25,"K2","Design & Concept")
	var_Items.ItemBar(h,"K1",33,65280)
	var_Items.ItemBar(h,"K2",33,65280)
oG2antt.EndUpdate()
|
|
960
|
How can I remove all bars from the chart
OleObject oG2antt,var_Items

oG2antt = ole_1.Object
oG2antt.Columns.Add("Task")
oG2antt.Chart.FirstVisibleDate = 2001-01-01
var_Items = oG2antt.Items
	var_Items.AddBar(var_Items.AddItem("Task 1"),"Task",2001-01-02,2001-01-04,"K1")
	var_Items.AddBar(var_Items.AddItem("Task 2"),"Task",2001-01-02,2001-01-04,"K1")
	var_Items.AddBar(var_Items.AddItem("Task 3"),"Task",2001-01-02,2001-01-04,"K1")
	var_Items.AddBar(var_Items.AddItem("Task 4"),"Task",2001-01-02,2001-01-04,"K2")
	var_Items.ClearBars(0)
|
|
959
|
How can I change the color for all bars with a specified key
OleObject oG2antt,var_Items

oG2antt = ole_1.Object
oG2antt.Columns.Add("Task")
oG2antt.Chart.FirstVisibleDate = 2001-01-01
var_Items = oG2antt.Items
	var_Items.AddBar(var_Items.AddItem("Task 1"),"Task",2001-01-02,2001-01-04,"K1")
	var_Items.AddBar(var_Items.AddItem("Task 2"),"Task",2001-01-02,2001-01-04,"K1")
	var_Items.AddBar(var_Items.AddItem("Task 3"),"Task",2001-01-02,2001-01-04,"K1")
	var_Items.AddBar(var_Items.AddItem("Task 4"),"Task",2001-01-02,2001-01-04,"K2")
	var_Items.ItemBar(0,"K1",33,255)
|
|
958
|
Is there any automatic way to change a property for all bars with a specified key
OleObject oG2antt,var_Items

oG2antt = ole_1.Object
oG2antt.Columns.Add("Task")
oG2antt.Chart.FirstVisibleDate = 2001-01-01
var_Items = oG2antt.Items
	var_Items.AddBar(var_Items.AddItem("Task 1"),"Task",2001-01-02,2001-01-04,"K1")
	var_Items.AddBar(var_Items.AddItem("Task 2"),"Task",2001-01-02,2001-01-04,"K1")
	var_Items.AddBar(var_Items.AddItem("Task 3"),"Task",2001-01-02,2001-01-04,"K1")
	var_Items.AddBar(var_Items.AddItem("Task 4"),"Task",2001-01-02,2001-01-04,"K2")
	var_Items.ItemBar(0,"K1",33,255)
|
|
957
|
How can I remove all bars with specified key
OleObject oG2antt,var_Items

oG2antt = ole_1.Object
oG2antt.Columns.Add("Task")
oG2antt.Chart.FirstVisibleDate = 2001-01-01
var_Items = oG2antt.Items
	var_Items.AddBar(var_Items.AddItem("Task 1"),"Task",2001-01-02,2001-01-04,"K1")
	var_Items.AddBar(var_Items.AddItem("Task 2"),"Task",2001-01-02,2001-01-04,"K1")
	var_Items.AddBar(var_Items.AddItem("Task 3"),"Task",2001-01-02,2001-01-04,"K1")
	var_Items.AddBar(var_Items.AddItem("Task 4"),"Task",2001-01-02,2001-01-04,"K2")
	var_Items.RemoveBar(0,"K1")
|
|
956
|
How do I several bars with different vertical offsets
OleObject oG2antt,var_Items
any h

oG2antt = ole_1.Object
oG2antt.Chart.FirstVisibleDate = 2001-01-01
oG2antt.Columns.Add("Column")
var_Items = oG2antt.Items
	h = var_Items.AddItem("Item")
	var_Items.ItemHeight(h,62)
	var_Items.AddBar(h,"Task",2001-01-02,2001-01-04,"T1")
	var_Items.ItemBar(h,"T1",18,-23)
	var_Items.AddBar(h,"Task",2001-01-02,2001-01-04,"T2")
	var_Items.ItemBar(h,"T2",18,-11)
	var_Items.AddBar(h,"Task",2001-01-02,2001-01-04,"T3")
	var_Items.ItemBar(h,"T3",18,1)
	var_Items.AddBar(h,"Task",2001-01-02,2001-01-04,"T4")
	var_Items.ItemBar(h,"T4",18,13)
	var_Items.AddBar(h,"Task",2001-01-02,2001-01-04,"T5")
	var_Items.ItemBar(h,"T5",18,25)
|
|
955
|
Is there any option to show gradient bars without using EBN technology
OleObject oG2antt,var_Bar,var_Items
any h

oG2antt = ole_1.Object
oG2antt.Columns.Add("Task")
oG2antt.Chart.FirstVisibleDate = 2001-01-01
var_Bar = oG2antt.Chart.Bars.Item("Task")
	var_Bar.Color = RGB(255,0,0)
	var_Bar.StartColor = RGB(0,255,0)
	var_Bar.EndColor = RGB(255,255,0)
	var_Bar.Pattern = 32
var_Items = oG2antt.Items
	h = var_Items.AddItem("Task")
	var_Items.AddBar(h,"Task",2001-01-02,2001-01-05,"")
|
|
954
|
How can I define a bar with border and solid filling
OleObject oG2antt,var_Bar,var_Items
any h

oG2antt = ole_1.Object
oG2antt.Columns.Add("Task")
oG2antt.Chart.FirstVisibleDate = 2001-01-01
var_Bar = oG2antt.Chart.Bars.Item("Task")
	var_Bar.Color = RGB(255,0,0)
	var_Bar.StartColor = RGB(255,255,0)
	var_Bar.EndColor = RGB(255,255,0)
	var_Bar.Pattern = 32
var_Items = oG2antt.Items
	h = var_Items.AddItem("Task")
	var_Items.AddBar(h,"Task",2001-01-02,2001-01-05,"")
|
|
953
|
How can I define a bar with border and solid filling

OleObject oG2antt,var_Bar,var_Items
any h

oG2antt = ole_1.Object
oG2antt.Columns.Add("Task")
oG2antt.Chart.FirstVisibleDate = 2001-01-01
var_Bar = oG2antt.Chart.Bars.Item("Task")
	var_Bar.Color = RGB(255,0,0)
	var_Bar.Pattern = 32
	var_Bar.Height = 18
var_Items = oG2antt.Items
	h = var_Items.AddItem("Task")
	var_Items.AddBar(h,"Task",2001-01-02,2001-01-05,"")
	var_Items.ItemBar(h,"",7,65535)
|
|
952
|
How do I define a bar with solid border and filling

OleObject oG2antt,var_Bar,var_Items
any h

oG2antt = ole_1.Object
oG2antt.VisualAppearance.Add(1,"C:\Program Files\Exontrol\ExG2antt.NET\sample\EBN\blackboxt.ebn")
oG2antt.Columns.Add("Task")
oG2antt.Chart.FirstVisibleDate = 2001-01-01
var_Bar = oG2antt.Chart.Bars.Item("Task")
	var_Bar.Color = 16777216 /*0x1000000*/
	var_Bar.Height = 18
var_Items = oG2antt.Items
	h = var_Items.AddItem("Task")
	var_Items.AddBar(h,"Task",2001-01-02,2001-01-05,"")
	var_Items.ItemBar(h,"",33,255)
	var_Items.ItemBar(h,"",7,65535)
|
|
951
|
Can I control the units/resource/effort being allocated to a bar when displaying OverAllocation histogram
OleObject oG2antt,var_Bar,var_Chart,var_Column,var_Items
any h1

oG2antt = ole_1.Object
oG2antt.BeginUpdate()
oG2antt.Columns.Add("Tasks")
var_Column = oG2antt.Columns.Add("Effort")
	var_Column.Def(18,21)
	var_Column.Editor.EditType = 4
var_Chart = oG2antt.Chart
	var_Chart.LevelCount = 2
	var_Chart.NonworkingDays = 0
	var_Chart.PaneWidth(false,96)
	var_Chart.FirstVisibleDate = 2005-06-20
	var_Chart.HistogramVisible = true
	var_Chart.HistogramHeight = 202
	var_Chart.HistogramView = 112
	var_Bar = var_Chart.Bars.Item("Task")
		var_Bar.HistogramPattern = 2050 /*exRectangularCurve | exPatternDot*/
		var_Bar.HistogramType = 1
		var_Bar.HistogramCriticalValue = 50
		var_Bar.HistogramGridLinesColor = RGB(192,192,192)
		var_Bar.HistogramRulerLinesColor = RGB(0,0,1)
var_Items = oG2antt.Items
	var_Items.AllowCellValueToItemBar = true
	h1 = var_Items.AddItem("Task 1")
	var_Items.AddBar(h1,"Task",2005-06-21,2005-06-25)
	var_Items.CellValue(h1,1,2)
	h1 = var_Items.AddItem("Task 2")
	var_Items.AddBar(h1,"Task",2005-06-24,2005-06-28)
	var_Items.CellValue(h1,1,1)
	h1 = var_Items.AddItem("Task 3")
	var_Items.AddBar(h1,"Task",2005-06-27,2005-07-01)
	var_Items.CellValue(h1,1,2)
	h1 = var_Items.AddItem("Task 4")
	var_Items.AddBar(h1,"Task",2005-06-30,2005-07-02)
	var_Items.CellValue(h1,1,1)
oG2antt.EndUpdate()
|
|
950
|
Can I control the units/resource/effort being allocated to a bar when displaying Overload histogram
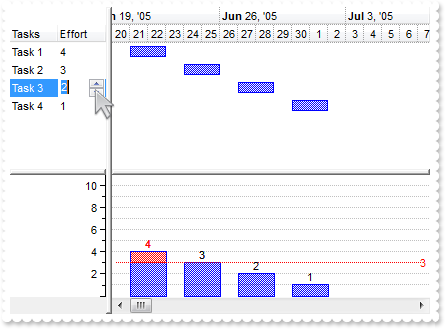
OleObject oG2antt,var_Bar,var_Chart,var_Column,var_Items
any h1

oG2antt = ole_1.Object
oG2antt.BeginUpdate()
oG2antt.Columns.Add("Tasks")
var_Column = oG2antt.Columns.Add("Effort")
	var_Column.Def(18,21)
	var_Column.Editor.EditType = 4
var_Chart = oG2antt.Chart
	var_Chart.LevelCount = 2
	var_Chart.NonworkingDays = 0
	var_Chart.PaneWidth(false,96)
	var_Chart.FirstVisibleDate = 2005-06-20
	var_Chart.HistogramVisible = true
	var_Chart.HistogramHeight = 128
	var_Chart.HistogramView = 112
	var_Bar = var_Chart.Bars.Item("Task")
		var_Bar.HistogramPattern = var_Bar.Pattern
		var_Bar.HistogramType = 0
		var_Bar.HistogramCriticalValue = 3
		var_Bar.ShowHistogramValues = "value>3?255:1"
		var_Bar.HistogramItems = -11
		var_Bar.HistogramGridLinesColor = RGB(192,192,192)
		var_Bar.HistogramRulerLinesColor = RGB(0,0,1)
var_Items = oG2antt.Items
	var_Items.AllowCellValueToItemBar = true
	h1 = var_Items.AddItem("Task 1")
	var_Items.AddBar(h1,"Task",2005-06-21,2005-06-23)
	var_Items.CellValue(h1,1,4)
	h1 = var_Items.AddItem("Task 2")
	var_Items.AddBar(h1,"Task",2005-06-24,2005-06-26)
	var_Items.CellValue(h1,1,3)
	h1 = var_Items.AddItem("Task 3")
	var_Items.AddBar(h1,"Task",2005-06-27,2005-06-29)
	var_Items.CellValue(h1,1,2)
	h1 = var_Items.AddItem("Task 4")
	var_Items.AddBar(h1,"Task",2005-06-30,2005-07-02)
	var_Items.CellValue(h1,1,1)
oG2antt.EndUpdate()
|
|
949
|
How can I display double-lines curves in the histogram
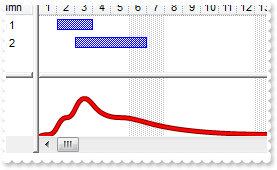
OleObject oG2antt,var_Bar,var_Chart,var_Items

oG2antt = ole_1.Object
oG2antt.AntiAliasing = true
var_Chart = oG2antt.Chart
	var_Chart.PaneWidth(false,48)
	var_Chart.FirstVisibleDate = 2001-01-01
	var_Chart.HistogramVisible = true
	var_Chart.HistogramHeight = 64
	var_Bar = var_Chart.Bars.Item("Task")
		var_Bar.HistogramPattern = 512
		var_Bar.HistogramItems = 3
		var_Bar.HistogramBorderColor = RGB(128,0,0)
		var_Bar.HistogramColor = RGB(255,0,0)
oG2antt.Columns.Add("Column")
var_Items = oG2antt.Items
	var_Items.AddBar(var_Items.AddItem("Item 1"),"Task",2001-01-02,2001-01-04)
	var_Items.AddBar(var_Items.AddItem("Item 2"),"Task",2001-01-03,2001-01-07)
|
|
948
|
Is there any option to display values in the histogram using different colors
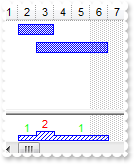
OleObject oG2antt,var_Bar,var_Chart,var_Items

oG2antt = ole_1.Object
var_Chart = oG2antt.Chart
	var_Chart.FirstVisibleDate = 2001-01-01
	var_Chart.HistogramVisible = true
	var_Chart.HistogramHeight = 32
	var_Bar = var_Chart.Bars.Item("Task")
		var_Bar.HistogramPattern = 6
		var_Bar.HistogramItems = 6
		var_Bar.ShowHistogramValues = "value>1?255:65280"
oG2antt.Columns.Add("Column")
var_Items = oG2antt.Items
	var_Items.AddBar(var_Items.AddItem("Item 1"),"Task",2001-01-02,2001-01-04)
	var_Items.AddBar(var_Items.AddItem("Item 1"),"Task",2001-01-03,2001-01-07)
|
|
947
|
Is there any option to display values in the histogram using different colors
OleObject oG2antt,var_Bar,var_Chart,var_Items

oG2antt = ole_1.Object
var_Chart = oG2antt.Chart
	var_Chart.FirstVisibleDate = 2001-01-01
	var_Chart.HistogramVisible = true
	var_Chart.HistogramHeight = 32
	var_Bar = var_Chart.Bars.Item("Task")
		var_Bar.HistogramPattern = 6
		var_Bar.HistogramItems = 6
		var_Bar.ShowHistogramValues = "value>1?255:1"
oG2antt.Columns.Add("Column")
var_Items = oG2antt.Items
	var_Items.AddBar(var_Items.AddItem("Item 1"),"Task",2001-01-02,2001-01-04)
	var_Items.AddBar(var_Items.AddItem("Item 1"),"Task",2001-01-03,2001-01-07)
|
|
946
|
How can I display only few values in the histogram, such as the values greater than a value
OleObject oG2antt,var_Bar,var_Chart,var_Items

oG2antt = ole_1.Object
var_Chart = oG2antt.Chart
	var_Chart.FirstVisibleDate = 2001-01-01
	var_Chart.HistogramVisible = true
	var_Chart.HistogramHeight = 32
	var_Bar = var_Chart.Bars.Item("Task")
		var_Bar.HistogramPattern = 6
		var_Bar.ShowHistogramValues = "value>1"
oG2antt.Columns.Add("Column")
var_Items = oG2antt.Items
	var_Items.AddBar(var_Items.AddItem("Item 1"),"Task",2001-01-02,2001-01-04)
	var_Items.AddBar(var_Items.AddItem("Item 1"),"Task",2001-01-03,2001-01-07)
|
|
945
|
How can I display values in the histogram
OleObject oG2antt,var_Bar,var_Chart,var_Items

oG2antt = ole_1.Object
var_Chart = oG2antt.Chart
	var_Chart.FirstVisibleDate = 2001-01-01
	var_Chart.HistogramVisible = true
	var_Chart.HistogramHeight = 32
	var_Bar = var_Chart.Bars.Item("Task")
		var_Bar.HistogramPattern = 6
		var_Bar.ShowHistogramValues = "1"
oG2antt.Columns.Add("Column")
var_Items = oG2antt.Items
	var_Items.AddBar(var_Items.AddItem("Item 1"),"Task",2001-01-02,2001-01-04)
	var_Items.AddBar(var_Items.AddItem("Item 1"),"Task",2001-01-03,2001-01-07)
|
|
944
|
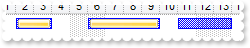
How can I scroll the chart to find a bar
OleObject oG2antt,var_Items
any h

oG2antt = ole_1.Object
oG2antt.Columns.Add("Column")
oG2antt.Chart.LevelCount = 2
oG2antt.Chart.PaneWidth(false,64)
oG2antt.DefaultItemHeight = 32
var_Items = oG2antt.Items
	var_Items.AddBar(var_Items.AddItem("Item 1"),"Task",2001-01-02,2001-01-04,1)
	var_Items.AddBar(var_Items.AddItem("Item 2"),"Task",2001-01-02,2001-01-04,2)
	var_Items.AddBar(var_Items.AddItem("Item 3"),"Task",2001-01-02,2001-01-04,3)
	var_Items.AddBar(var_Items.AddItem("Item 4"),"Task",2001-01-02,2001-01-04,4)
	var_Items.AddBar(var_Items.AddItem("Item 5"),"Task",2001-01-02,2001-01-04,5)
	var_Items.AddBar(var_Items.AddItem("Item 6"),"Task",2001-01-02,2001-01-04,6)
	var_Items.AddBar(var_Items.AddItem("Item 7"),"Task",2001-01-02,2001-01-04,7)
	var_Items.AddBar(var_Items.AddItem("Item 8"),"Task",2001-01-02,2001-01-04,8)
	var_Items.AddBar(var_Items.AddItem("Item 9"),"Task",2001-01-02,2001-01-04,8)
	var_Items.AddBar(var_Items.AddItem("Item 10"),"Task",2001-01-02,2001-01-04,10)
	var_Items.AddBar(var_Items.AddItem("Item 11"),"Task",2001-01-02,2001-01-04,11)
	var_Items.AddBar(var_Items.AddItem("Item 12"),"Task",2001-01-02,2001-01-04,12)
	var_Items.AddBar(var_Items.AddItem("Item 13"),"Task",2001-01-02,2001-01-04,13)
	var_Items.AddBar(var_Items.AddItem("Item 14"),"Task",2001-01-02,2001-01-04,14)
h = oG2antt.Items.FindBar(14)
oG2antt.Items.EnsureVisibleItem(h)
oG2antt.Chart.ScrollTo(oG2antt.Items.ItemBar(h,14,1),1)
|
|
943
|
Can I change the color/marker/frame for selected bars
OleObject oG2antt,var_Appearance,var_Chart,var_Items
any h

oG2antt = ole_1.Object
oG2antt.BeginUpdate()
var_Appearance = oG2antt.VisualAppearance
	var_Appearance.Add(2,"c:\exontrol\images\normal.ebn")
	var_Appearance.Add(1,"CP:2 3 2 -3 -2")
var_Chart = oG2antt.Chart
	var_Chart.FirstVisibleDate = 2002-01-01
	var_Chart.SelBarColor = 16777216 /*0x1000000*/
	var_Chart.PaneWidth(false,48)
oG2antt.Columns.Add("Task")
var_Items = oG2antt.Items
	h = var_Items.AddItem("Task 1")
	var_Items.AddBar(h,"Task",2002-01-02,2002-01-04,"A")
	var_Items.AddBar(h,"Task",2002-01-06,2002-01-10,"B")
	var_Items.AddBar(h,"Task",2002-01-11,2002-01-14,"C")
	var_Items.ItemBar(h,"A",257,true)
	var_Items.ItemBar(h,"B",257,true)
oG2antt.EndUpdate()
|
|
942
|
Can I display a larger marker for selected bars, eventually using the EBN technology
OleObject oG2antt,var_Chart,var_Items
any h

oG2antt = ole_1.Object
oG2antt.BeginUpdate()
oG2antt.VisualAppearance.Add(1,"c:\exontrol\images\normal.ebn")
var_Chart = oG2antt.Chart
	var_Chart.FirstVisibleDate = 2002-01-01
	var_Chart.SelBarColor = 16777216 /*0x1000000*/
	var_Chart.PaneWidth(false,48)
oG2antt.Columns.Add("Task")
var_Items = oG2antt.Items
	h = var_Items.AddItem("Task 1")
	var_Items.AddBar(h,"Task",2002-01-02,2002-01-04,"A")
	var_Items.AddBar(h,"Task",2002-01-06,2002-01-10,"B")
	var_Items.AddBar(h,"Task",2002-01-11,2002-01-14,"C")
	var_Items.ItemBar(h,"A",257,true)
	var_Items.ItemBar(h,"B",257,true)
oG2antt.EndUpdate()
|
|
941
|
How do I change the color for the selected bars
OleObject oG2antt,var_Chart,var_Items
any h

oG2antt = ole_1.Object
oG2antt.BeginUpdate()
oG2antt.Debug = true
var_Chart = oG2antt.Chart
	var_Chart.FirstVisibleDate = 2002-01-01
	var_Chart.SelBarColor = RGB(255,0,0)
	var_Chart.PaneWidth(false,48)
oG2antt.Columns.Add("Task")
var_Items = oG2antt.Items
	h = var_Items.AddItem("Task 1")
	var_Items.AddBar(h,"Task",2002-01-02,2002-01-04,"A")
	var_Items.AddBar(h,"Task",2002-01-06,2002-01-10,"B")
	var_Items.AddBar(h,"Task",2002-01-11,2002-01-14,"C")
	var_Items.ItemBar(h,"A",257,true)
	var_Items.ItemBar(h,"B",257,true)
oG2antt.EndUpdate()
|
|
940
|
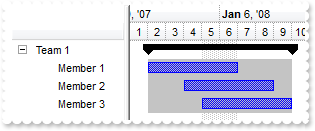
How can I change the background color for child bars of a summary bar
OleObject oG2antt,var_Chart,var_Items
any h1,hR1

oG2antt = ole_1.Object
oG2antt.BeginUpdate()
oG2antt.LinesAtRoot = -1
oG2antt.HasLines = false
var_Chart = oG2antt.Chart
	var_Chart.AllowCreateBar = false
	var_Chart.AllowLinkBars = false
	var_Chart.FirstVisibleDate = 2008-01-01
	var_Chart.LevelCount = 2
	var_Chart.PaneWidth(false,112)
oG2antt.Columns.Add("")
var_Items = oG2antt.Items
	hR1 = var_Items.AddItem("Team 1")
	var_Items.AddBar(hR1,"Summary",2008-01-02,2008-01-08,"")
	var_Items.ItemBar(hR1,"",34,12895428)
	h1 = var_Items.InsertItem(hR1,,"Member 1")
	var_Items.AddBar(h1,"Task",2008-01-02,2008-01-07)
	var_Items.DefineSummaryBars(hR1,"",h1,"")
	h1 = var_Items.InsertItem(hR1,,"Member 2")
	var_Items.AddBar(h1,"Task",2008-01-04,2008-01-09)
	var_Items.DefineSummaryBars(hR1,"",h1,"")
	h1 = var_Items.InsertItem(hR1,,"Member 3")
	var_Items.AddBar(h1,"Task",2008-01-05,2008-01-10)
	var_Items.DefineSummaryBars(hR1,"",h1,"")
	var_Items.ExpandItem(hR1,true)
oG2antt.EndUpdate()
|
|
939
|
How can I allow resizing the bar only in the right part of the bar
OleObject oG2antt,var_Items
any h

oG2antt = ole_1.Object
oG2antt.Columns.Add("Task")
oG2antt.Chart.FirstVisibleDate = 2001-01-01
var_Items = oG2antt.Items
	h = var_Items.AddItem("Task 1")
	var_Items.AddBar(h,"Task",2001-01-02,2001-01-06,"K1")
	var_Items.ItemBar(h,"K1",10,2)
|
|
938
|
How can I allow resizing the bar only in the left part of the bar
OleObject oG2antt,var_Items
any h

oG2antt = ole_1.Object
oG2antt.Columns.Add("Task")
oG2antt.Chart.FirstVisibleDate = 2001-01-01
var_Items = oG2antt.Items
	h = var_Items.AddItem("Task 1")
	var_Items.AddBar(h,"Task",2001-01-02,2001-01-06,"K1")
	var_Items.ItemBar(h,"K1",10,1)
|
|
937
|
How can I show the links that starts from selected bar being more visible, while the rest being transparent
OleObject oG2antt,var_Chart,var_Items
any h1,h2,h3

oG2antt = ole_1.Object
oG2antt.BeginUpdate()
oG2antt.Columns.Add("Tasks")
var_Chart = oG2antt.Chart
	var_Chart.FirstVisibleDate = 2006-09-20
	var_Chart.PaneWidth(false,64)
	var_Chart.ShowLinksWidth(1,2)
	var_Chart.ShowLinksStyle(1,2)
	var_Chart.ShowLinksColor(2,RGB(200,200,200))
	var_Chart.ShowLinksColor(4,RGB(200,200,200))
var_Items = oG2antt.Items
	h1 = var_Items.AddItem("Task 1")
	var_Items.AddBar(h1,"Task",2006-09-21,2006-09-23)
	h2 = var_Items.AddItem("Task 2")
	var_Items.AddBar(h2,"Task",2006-09-25,2006-09-27)
	var_Items.ItemBar(h2,"",257,true)
	var_Items.AddLink("L1",h1,"",h2,"")
	var_Items.Link("L1",12,"L1")
	h3 = var_Items.AddItem("Task 3")
	var_Items.AddBar(h3,"Task",2006-09-29,2006-10-02)
	var_Items.AddLink("L2",h2,"",h3,"")
	var_Items.Link("L2",12,"L2")
oG2antt.EndUpdate()
|
|
936
|
How can I show only the links that starts from selected bar
OleObject oG2antt,var_Chart,var_Items
any h1,h2,h3

oG2antt = ole_1.Object
oG2antt.BeginUpdate()
oG2antt.MarkSearchColumn = false
oG2antt.OnResizeControl = 1
oG2antt.Columns.Add("Tasks")
oG2antt.Columns.Add("Start").Visible = false
oG2antt.Columns.Add("End").Visible = false
var_Chart = oG2antt.Chart
	var_Chart.FirstVisibleDate = 2006-09-20
	var_Chart.PaneWidth(false,64)
	var_Chart.ShowLinksColor(2,var_Chart.BackColor)
	var_Chart.ShowLinksColor(4,var_Chart.BackColor)
var_Items = oG2antt.Items
	h1 = var_Items.AddItem("Task 1")
	var_Items.CellValue(h1,1,2006-09-21)
	var_Items.CellValue(h1,2,2006-09-24)
	var_Items.AddBar(h1,"Task",var_Items.CellValue(h1,1),var_Items.CellValue(h1,2))
	h2 = var_Items.InsertItem(h,,"Task 2")
	var_Items.CellValue(h2,1,2006-09-25)
	var_Items.CellValue(h2,2,2006-09-28)
	var_Items.AddBar(h2,"Task",var_Items.CellValue(h2,1),var_Items.CellValue(h2,2))
	var_Items.ItemBar(h2,"",257,true)
	var_Items.AddLink("L1",h1,"",h2,"")
	h3 = var_Items.InsertItem(h,,"Task 3")
	var_Items.CellValue(h3,1,2006-09-29)
	var_Items.CellValue(h3,2,2006-10-02)
	var_Items.AddBar(h3,"Task",var_Items.CellValue(h3,1),var_Items.CellValue(h3,2))
	var_Items.AddLink("L2",h2,"",h3,"")
oG2antt.EndUpdate()
|
|
935
|
How can I hide links that are not related to selected bar
OleObject oG2antt,var_Chart,var_Items
any h1,h2,h3

oG2antt = ole_1.Object
oG2antt.BeginUpdate()
oG2antt.MarkSearchColumn = false
oG2antt.OnResizeControl = 1
oG2antt.Columns.Add("Tasks")
oG2antt.Columns.Add("Start").Visible = false
oG2antt.Columns.Add("End").Visible = false
var_Chart = oG2antt.Chart
	var_Chart.FirstVisibleDate = 2006-09-20
	var_Chart.PaneWidth(false,64)
	var_Chart.ShowLinksColor(4,var_Chart.BackColor)
var_Items = oG2antt.Items
	h1 = var_Items.AddItem("Task 1")
	var_Items.CellValue(h1,1,2006-09-21)
	var_Items.CellValue(h1,2,2006-09-24)
	var_Items.AddBar(h1,"Task",var_Items.CellValue(h1,1),var_Items.CellValue(h1,2))
	var_Items.ItemBar(h1,"",257,true)
	h2 = var_Items.InsertItem(h,,"Task 2")
	var_Items.CellValue(h2,1,2006-09-25)
	var_Items.CellValue(h2,2,2006-09-28)
	var_Items.AddBar(h2,"Task",var_Items.CellValue(h2,1),var_Items.CellValue(h2,2))
	var_Items.AddLink("L1",h1,"",h2,"")
	h3 = var_Items.InsertItem(h,,"Task 3")
	var_Items.CellValue(h3,1,2006-09-29)
	var_Items.CellValue(h3,2,2006-10-02)
	var_Items.AddBar(h3,"Task",var_Items.CellValue(h3,1),var_Items.CellValue(h3,2))
	var_Items.AddLink("L2",h2,"",h3,"")
oG2antt.EndUpdate()
|
|
934
|
How can I show the direction of the link using EBN files
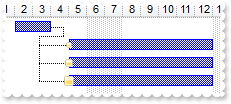
OleObject oG2antt,var_Appearance,var_Chart,var_Items
any h1,h2

oG2antt = ole_1.Object
oG2antt.BeginUpdate()
var_Appearance = oG2antt.VisualAppearance
	var_Appearance.Add(1,"c:\exontrol\images\normal.ebn")
	var_Appearance.Add(2,"CP:1 -1 -1 1 1")
	var_Appearance.Add(3,"CP:1 -2 -2 2 2")
var_Chart = oG2antt.Chart
	var_Chart.FirstVisibleDate = 2001-01-01
	var_Chart.PaneWidth(false,128)
oG2antt.Columns.Add("Column")
var_Items = oG2antt.Items
	h1 = var_Items.AddItem("Task 1")
	var_Items.AddBar(h1,"Task",2001-01-02,2001-01-04,"B1")
	h2 = var_Items.AddItem("Task 2")
	var_Items.AddBar(h2,"Task",2001-01-05,2001-01-13,"B2")
	var_Items.AddLink("L1",h1,"B1",h2,"B2")
	var_Items.Link("L1",14,16777216)
	h2 = var_Items.AddItem("Task 3")
	var_Items.AddBar(h2,"Task",2001-01-05,2001-01-13,"B3")
	var_Items.AddLink("L2",h1,"B1",h2,"B3")
	var_Items.Link("L2",14,33554432)
	h2 = var_Items.AddItem("Task 4")
	var_Items.AddBar(h2,"Task",2001-01-05,2001-01-13,"B5")
	var_Items.AddLink("L3",h1,"B1",h2,"B5")
	var_Items.Link("L3",14,50331648)
oG2antt.EndUpdate()
|
|
933
|
How can I show round links
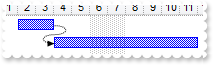
OleObject oG2antt,var_Items

oG2antt = ole_1.Object
oG2antt.Chart.FirstVisibleDate = 2001-01-01
oG2antt.Columns.Add("Column")
var_Items = oG2antt.Items
	var_Items.AddBar(var_Items.AddItem("Item 1"),"Task",2001-01-02,2001-01-04,"B1")
	var_Items.AddBar(var_Items.AddItem("Item 2"),"Task",2001-01-05,2001-01-13,"B2")
	var_Items.AddLink("L1",var_Items.FindItem("Item 1",0),"B1",var_Items.FindItem("Item 2",0),"B2")
	var_Items.Link("L1",15,true)
|
|
932
|
How can I change the color to display the arrow of the link
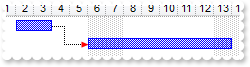
OleObject oG2antt,var_Items

oG2antt = ole_1.Object
oG2antt.Chart.FirstVisibleDate = 2001-01-01
oG2antt.Columns.Add("Column")
var_Items = oG2antt.Items
	var_Items.AddBar(var_Items.AddItem("Item 1"),"Task",2001-01-02,2001-01-04,"B1")
	var_Items.AddBar(var_Items.AddItem("Item 2"),"Task",2001-01-06,2001-01-14,"B2")
	var_Items.AddLink("L1",var_Items.FindItem("Item 1",0),"B1",var_Items.FindItem("Item 2",0),"B2")
	var_Items.Link("L1",14,255)
|
|
931
|
I use UnitScale: exHour and I want to show only from 9 to 18 hour. The idea is to show only the working part of a day. Is this possible
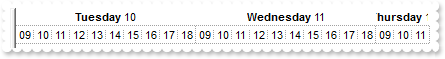
OleObject oG2antt,var_Chart,var_Level,var_Level1

oG2antt = ole_1.Object
oG2antt.BeginUpdate()
var_Chart = oG2antt.Chart
	var_Chart.MarkTodayColor = var_Chart.BackColor
	var_Chart.BackColorLevelHeader = RGB(255,255,255)
	var_Chart.PaneWidth(false,0)
	var_Chart.LevelCount = 2
	var_Level = var_Chart.Level(0)
		var_Level.Label = "<b><%dddd%></b> <%d%>"
		var_Level.Alignment = 1
		var_Level.DrawTickLines = 0
	var_Level1 = var_Chart.Level(1)
		var_Level1.Label = 65536
		var_Level1.DrawTickLines = 65 /*exLevelMiddleLine | exLevelDotLine*/
		var_Level1.DrawTickLinesFrom(0,1)
	var_Chart.NonworkingHours = 16253439
	var_Chart.ShowNonworkingUnits = false
	var_Chart.ShowNonworkingDates = false
	var_Chart.ShowNonworkingHours = false
oG2antt.EndUpdate()
|
|
930
|
Can I display tick lines from other level to my base level so time units gets separated more clearly
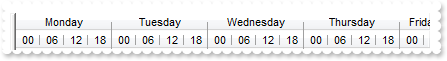
OleObject oG2antt,var_Chart,var_Level,var_Level1

oG2antt = ole_1.Object
oG2antt.BeginUpdate()
var_Chart = oG2antt.Chart
	var_Chart.DrawLevelSeparator = 0
	var_Chart.UnitWidth = 24
	var_Chart.FirstVisibleDate = 2001-01-01
	var_Chart.PaneWidth(false,0)
	var_Chart.LevelCount = 2
	var_Level = var_Chart.Level(0)
		var_Level.Alignment = 1
		var_Level.Label = "<%dddd%>"
		var_Level.DrawTickLines = 18 /*exLevelLowerHalf | exLevelSolidLine*/
	var_Level1 = var_Chart.Level(1)
		var_Level1.Label = 65536
		var_Level1.Count = 6
		var_Level1.DrawTickLines = 66 /*exLevelMiddleLine | exLevelSolidLine*/
		var_Level1.DrawTickLinesFrom(0,2)
oG2antt.EndUpdate()
|
|
929
|
Is there any property to change the style of the tick lines being shown in the chart
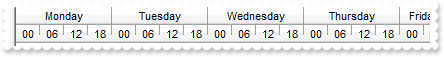
OleObject oG2antt,var_Chart,var_Level,var_Level1

oG2antt = ole_1.Object
oG2antt.BeginUpdate()
var_Chart = oG2antt.Chart
	var_Chart.UnitWidth = 24
	var_Chart.FirstVisibleDate = 2001-01-01
	var_Chart.PaneWidth(false,0)
	var_Chart.LevelCount = 2
	var_Level = var_Chart.Level(0)
		var_Level.Alignment = 1
		var_Level.Label = "<%dddd%>"
		var_Level.DrawTickLines = 2
	var_Level1 = var_Chart.Level(1)
		var_Level1.Label = 65536
		var_Level1.Count = 6
		var_Level1.DrawTickLines = 34 /*exLevelUpperHalf | exLevelSolidLine*/
	var_Chart.DrawLevelSeparator = 2
oG2antt.EndUpdate()
|
|
928
|
Is there any property to change the style of the tick lines being shown in the chart
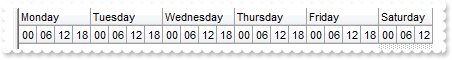
OleObject oG2antt,var_Chart,var_Level,var_Level1

oG2antt = ole_1.Object
oG2antt.BeginUpdate()
var_Chart = oG2antt.Chart
	var_Chart.FirstVisibleDate = 2001-01-01
	var_Chart.PaneWidth(false,0)
	var_Chart.LevelCount = 2
	var_Chart.DrawLevelSeparator = 2
	var_Level = var_Chart.Level(0)
		var_Level.Label = "<%dddd%>"
		var_Level.DrawTickLines = 2
	var_Level1 = var_Chart.Level(1)
		var_Level1.Label = 65536
		var_Level1.Count = 6
		var_Level1.DrawTickLines = 2
oG2antt.EndUpdate()
|
|
927
|
How can I show the levels based on the base level so tick lines aligns better
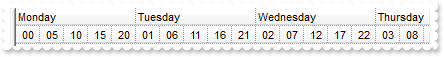
OleObject oG2antt,var_Chart,var_Level

oG2antt = ole_1.Object
oG2antt.BeginUpdate()
var_Chart = oG2antt.Chart
	var_Chart.AdjustLevelsToBase = true
	var_Chart.UnitWidth = 24
	var_Chart.FirstVisibleDate = 2001-01-01
	var_Chart.PaneWidth(false,0)
	var_Chart.LevelCount = 2
	var_Chart.Level(0).Label = "<%dddd%>"
	var_Level = var_Chart.Level(1)
		var_Level.Label = 65536
		var_Level.Count = 5
oG2antt.EndUpdate()
|
|
926
|
How can I show only working hours in other words only the working part of the day
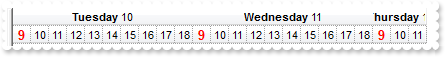
OleObject oG2antt,var_Chart,var_Level,var_Level1

oG2antt = ole_1.Object
oG2antt.BeginUpdate()
var_Chart = oG2antt.Chart
	var_Chart.AllowSelectDate = false
	var_Chart.MarkTodayColor = var_Chart.BackColor
	var_Chart.PaneWidth(false,0)
	var_Chart.LevelCount = 2
	var_Level = var_Chart.Level(0)
		var_Level.Label = "<b><%dddd%></b> <%d%>"
		var_Level.Alignment = 1
		var_Level.DrawTickLines = false
	var_Level1 = var_Chart.Level(1)
		var_Level1.Label = 65536
		var_Level1.ReplaceLabel("09","<fgcolor=FF0000><b><font ;10>9</font></b></fgcolor>")
	var_Chart.NonworkingHours = 16253439
	var_Chart.ShowNonworkingUnits = false
	var_Chart.ShowNonworkingDates = false
	var_Chart.ShowNonworkingHours = false
oG2antt.EndUpdate()
|
|
925
|
How can I specify the effort for bars when displaying the overload histogram
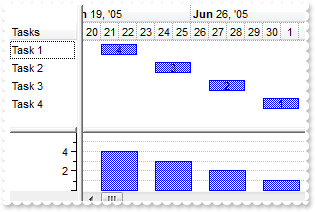
OleObject oG2antt,var_Bar,var_Chart,var_Items
any h1

oG2antt = ole_1.Object
oG2antt.BeginUpdate()
oG2antt.Columns.Add("Tasks")
var_Chart = oG2antt.Chart
	var_Chart.LevelCount = 2
	var_Chart.NonworkingDays = 0
	var_Chart.PaneWidth(false,52)
	var_Chart.FirstVisibleDate = 2005-06-20
	var_Chart.HistogramVisible = true
	var_Chart.HistogramHeight = 64
	var_Chart.HistogramView = 112
	var_Bar = var_Chart.Bars.Item("Task")
		var_Bar.HistogramPattern = var_Bar.Pattern
		var_Bar.HistogramType = 0
		var_Bar.HistogramItems = -6
		var_Bar.HistogramGridLinesColor = RGB(192,192,192)
		var_Bar.HistogramRulerLinesColor = RGB(0,0,1)
var_Items = oG2antt.Items
	h1 = var_Items.AddItem("Task 1")
	var_Items.AddBar(h1,"Task",2005-06-21,2005-06-23,"","4")
	var_Items.ItemBar(h1,"",21,4)
	h1 = var_Items.AddItem("Task 2")
	var_Items.AddBar(h1,"Task",2005-06-24,2005-06-26,"",3)
	var_Items.ItemBar(h1,"",21,3)
	h1 = var_Items.AddItem("Task 3")
	var_Items.AddBar(h1,"Task",2005-06-27,2005-06-29,"",2)
	var_Items.ItemBar(h1,"",21,2)
	h1 = var_Items.AddItem("Task 4")
	var_Items.AddBar(h1,"Task",2005-06-30,2005-07-02,"",1)
oG2antt.EndUpdate()
|
|
924
|
How can I display the cumulative histogram and showing the bars that generated it using different colors
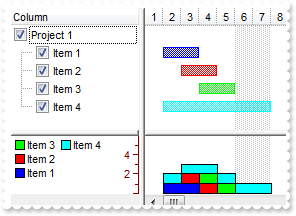
OleObject oG2antt,var_Bar,var_Chart,var_Column,var_Items
any h

oG2antt = ole_1.Object
oG2antt.BeginUpdate()
var_Chart = oG2antt.Chart
	var_Chart.FirstVisibleDate = 2001-01-01
	var_Chart.HistogramVisible = true
	var_Chart.HistogramHeight = 64
	var_Chart.PaneWidth(false,128)
	var_Chart.HistogramView = 1300 /*exHistogramNoGrouping | exHistogramLeafItems | exHistogramUnlockedItems | exHistogramCheckedItems*/
	var_Bar = var_Chart.Bars.Item("Task")
		var_Bar.HistogramPattern = 1
		var_Bar.HistogramType = 256
		var_Bar.HistogramCumulativeOriginalColorBars = false
		var_Bar.HistogramItems = 6
		var_Bar.HistogramRulerLinesColor = RGB(128,0,0)
		var_Bar.HistogramBorderColor = RGB(1,0,0)
var_Column = oG2antt.Columns.Add("Column")
	var_Column.Def(0,true)
	var_Column.PartialCheck = true
var_Items = oG2antt.Items
	h = var_Items.AddItem("Project 1")
	var_Items.AddBar(var_Items.InsertItem(h,,"Item 1"),"Task",2001-01-02,2001-01-04)
	var_Items.AddBar(var_Items.InsertItem(h,,"Item 2"),"Task",2001-01-03,2001-01-05)
	var_Items.AddBar(var_Items.InsertItem(h,,"Item 3"),"Task",2001-01-04,2001-01-06)
	var_Items.AddBar(var_Items.InsertItem(h,,"Item 4"),"Task",2001-01-02,2001-01-08)
	var_Items.CellState(var_Items.ItemByIndex(1),0,1)
	var_Items.ExpandItem(h,true)
oG2antt.EndUpdate()
|
|
923
|
How can I show the cumulative histogram for my bar
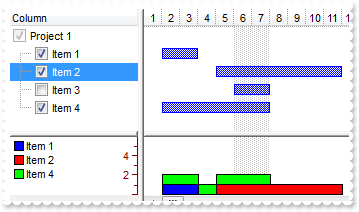
OleObject oG2antt,var_Bar,var_Chart,var_Column,var_Items
any h

oG2antt = ole_1.Object
oG2antt.BeginUpdate()
var_Chart = oG2antt.Chart
	var_Chart.FirstVisibleDate = 2001-01-01
	var_Chart.HistogramVisible = true
	var_Chart.HistogramHeight = 64
	var_Chart.PaneWidth(false,128)
	var_Chart.HistogramView = 1300 /*exHistogramNoGrouping | exHistogramLeafItems | exHistogramUnlockedItems | exHistogramCheckedItems*/
	var_Bar = var_Chart.Bars.Item("Task")
		var_Bar.HistogramPattern = 1
		var_Bar.HistogramType = 256
		var_Bar.HistogramItems = 6
		var_Bar.HistogramRulerLinesColor = RGB(128,0,0)
		var_Bar.HistogramBorderColor = RGB(1,0,0)
var_Column = oG2antt.Columns.Add("Column")
	var_Column.Def(0,true)
	var_Column.PartialCheck = true
var_Items = oG2antt.Items
	h = var_Items.AddItem("Project 1")
	var_Items.AddBar(var_Items.InsertItem(h,,"Item 1"),"Task",2001-01-02,2001-01-04)
	var_Items.AddBar(var_Items.InsertItem(h,,"Item 2"),"Task",2001-01-03,2001-01-05)
	var_Items.AddBar(var_Items.InsertItem(h,,"Item 3"),"Task",2001-01-04,2001-01-06)
	var_Items.AddBar(var_Items.InsertItem(h,,"Item 4"),"Task",2001-01-02,2001-01-08)
	var_Items.CellState(var_Items.ItemByIndex(1),0,1)
	var_Items.ExpandItem(h,true)
oG2antt.EndUpdate()
|
|
922
|
How can I show some grid lines or ruler in the histogram
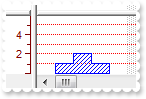
OleObject oG2antt,var_Bar,var_Chart,var_Items
any h

oG2antt = ole_1.Object
var_Chart = oG2antt.Chart
	var_Chart.FirstVisibleDate = 2001-01-01
	var_Chart.HistogramVisible = true
	var_Chart.HistogramHeight = 64
	var_Chart.PaneWidth(false,78)
	var_Chart.HistogramView = 1300 /*exHistogramNoGrouping | exHistogramLeafItems | exHistogramUnlockedItems | exHistogramCheckedItems*/
	var_Bar = var_Chart.Bars.Item("Task")
		var_Bar.HistogramPattern = 6
		var_Bar.HistogramItems = 6
		var_Bar.HistogramRulerLinesColor = RGB(128,0,0)
		var_Bar.HistogramGridLinesColor = RGB(255,0,0)
oG2antt.Columns.Add("Column")
var_Items = oG2antt.Items
	h = var_Items.AddItem("Project 1")
	var_Items.CellHasCheckBox(h,0,true)
	var_Items.CellState(h,0,1)
	var_Items.AddBar(var_Items.InsertItem(h,,"Item 1"),"Task",2001-01-02,2001-01-04)
	var_Items.AddBar(var_Items.InsertItem(h,,"Item 2"),"Task",2001-01-03,2001-01-05)
	var_Items.ExpandItem(h,true)
|
|
921
|
Is there any property to show some grid lines in the histogram
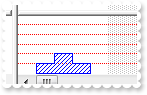
OleObject oG2antt,var_Bar,var_Chart,var_Items
any h

oG2antt = ole_1.Object
var_Chart = oG2antt.Chart
	var_Chart.FirstVisibleDate = 2001-01-01
	var_Chart.HistogramVisible = true
	var_Chart.HistogramHeight = 64
	var_Chart.PaneWidth(false,78)
	var_Chart.HistogramView = 1300 /*exHistogramNoGrouping | exHistogramLeafItems | exHistogramUnlockedItems | exHistogramCheckedItems*/
	var_Bar = var_Chart.Bars.Item("Task")
		var_Bar.HistogramPattern = 6
		var_Bar.HistogramItems = 6
		var_Bar.HistogramGridLinesColor = RGB(255,0,0)
oG2antt.Columns.Add("Column")
var_Items = oG2antt.Items
	h = var_Items.AddItem("Project 1")
	var_Items.CellHasCheckBox(h,0,true)
	var_Items.CellState(h,0,1)
	var_Items.AddBar(var_Items.InsertItem(h,,"Item 1"),"Task",2001-01-02,2001-01-04)
	var_Items.AddBar(var_Items.InsertItem(h,,"Item 2"),"Task",2001-01-03,2001-01-05)
	var_Items.ExpandItem(h,true)
|
|
920
|
How can I specify a fixed number of bars/items being shown in the histogram
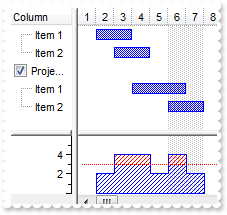
OleObject oG2antt,var_Bar,var_Chart,var_Items
any h

oG2antt = ole_1.Object
var_Chart = oG2antt.Chart
	var_Chart.FirstVisibleDate = 2001-01-01
	var_Chart.HistogramVisible = true
	var_Chart.HistogramHeight = 64
	var_Chart.PaneWidth(false,78)
	var_Chart.HistogramView = 1300 /*exHistogramNoGrouping | exHistogramLeafItems | exHistogramUnlockedItems | exHistogramCheckedItems*/
	var_Bar = var_Chart.Bars.Item("Task")
		var_Bar.HistogramPattern = 6
		var_Bar.HistogramCriticalValue = 3
		var_Bar.HistogramItems = -6
		var_Bar.HistogramRulerLinesColor = RGB(1,0,0)
oG2antt.Columns.Add("Column")
var_Items = oG2antt.Items
	h = var_Items.AddItem("Project 1")
	var_Items.CellHasCheckBox(h,0,true)
	var_Items.CellState(h,0,1)
	var_Items.AddBar(var_Items.InsertItem(h,,"Item 1"),"Task",2001-01-02,2001-01-04)
	var_Items.AddBar(var_Items.InsertItem(h,,"Item 2"),"Task",2001-01-03,2001-01-05)
	var_Items.ExpandItem(h,true)
	h = var_Items.AddItem("Project 2")
	var_Items.CellHasCheckBox(h,0,true)
	var_Items.CellState(h,0,1)
	var_Items.AddBar(var_Items.InsertItem(h,,"Item 1"),"Task",2001-01-04,2001-01-07)
	var_Items.AddBar(var_Items.InsertItem(h,,"Item 2"),"Task",2001-01-06,2001-01-08)
	var_Items.ExpandItem(h,true)
	h = var_Items.AddItem("Project 3")
	var_Items.CellHasCheckBox(h,0,true)
	var_Items.CellState(h,0,1)
	var_Items.AddBar(var_Items.InsertItem(h,,"Item 1"),"Task",2001-01-02,2001-01-04)
	var_Items.AddBar(var_Items.InsertItem(h,,"Item 2"),"Task",2001-01-03,2001-01-05)
	var_Items.ExpandItem(h,true)
	h = var_Items.AddItem("Project 4")
	var_Items.CellHasCheckBox(h,0,true)
	var_Items.CellState(h,0,1)
	var_Items.AddBar(var_Items.InsertItem(h,,"Item 1"),"Task",2001-01-04,2001-01-07)
	var_Items.AddBar(var_Items.InsertItem(h,,"Item 2"),"Task",2001-01-06,2001-01-08)
	var_Items.ExpandItem(h,true)
|
|
919
|
Is there any option to specify a minimum number of bars/items displayed in the histogram
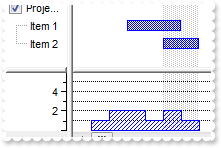
OleObject oG2antt,var_Bar,var_Chart,var_Items
any h

oG2antt = ole_1.Object
var_Chart = oG2antt.Chart
	var_Chart.FirstVisibleDate = 2001-01-01
	var_Chart.HistogramVisible = true
	var_Chart.HistogramHeight = 64
	var_Chart.PaneWidth(false,78)
	var_Chart.HistogramView = 1300 /*exHistogramNoGrouping | exHistogramLeafItems | exHistogramUnlockedItems | exHistogramCheckedItems*/
	var_Bar = var_Chart.Bars.Item("Task")
		var_Bar.HistogramPattern = 6
		var_Bar.HistogramItems = 6
		var_Bar.HistogramGridLinesColor = RGB(1,0,0)
		var_Bar.HistogramRulerLinesColor = RGB(1,0,0)
oG2antt.Columns.Add("Column")
var_Items = oG2antt.Items
	h = var_Items.AddItem("Project 1")
	var_Items.CellHasCheckBox(h,0,true)
	var_Items.CellState(h,0,1)
	var_Items.AddBar(var_Items.InsertItem(h,,"Item 1"),"Task",2001-01-02,2001-01-04)
	var_Items.AddBar(var_Items.InsertItem(h,,"Item 2"),"Task",2001-01-03,2001-01-05)
	var_Items.ExpandItem(h,true)
	h = var_Items.AddItem("Project 2")
	var_Items.CellHasCheckBox(h,0,true)
	var_Items.CellState(h,0,1)
	var_Items.AddBar(var_Items.InsertItem(h,,"Item 1"),"Task",2001-01-04,2001-01-07)
	var_Items.AddBar(var_Items.InsertItem(h,,"Item 2"),"Task",2001-01-06,2001-01-08)
	var_Items.ExpandItem(h,true)
|
|
918
|
How can I show the histogram without grouping the bars based on their parents
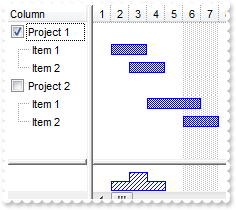
OleObject oG2antt,var_Chart,var_Items
any h

oG2antt = ole_1.Object
var_Chart = oG2antt.Chart
	var_Chart.FirstVisibleDate = 2001-01-01
	var_Chart.HistogramVisible = true
	var_Chart.HistogramHeight = 32
	var_Chart.HistogramView = 1300 /*exHistogramNoGrouping | exHistogramLeafItems | exHistogramUnlockedItems | exHistogramCheckedItems*/
	var_Chart.Bars.Item("Task").HistogramPattern = 6
oG2antt.Columns.Add("Column")
var_Items = oG2antt.Items
	h = var_Items.AddItem("Project 1")
	var_Items.CellHasCheckBox(h,0,true)
	var_Items.CellState(h,0,1)
	var_Items.AddBar(var_Items.InsertItem(h,,"Item 1"),"Task",2001-01-02,2001-01-04)
	var_Items.AddBar(var_Items.InsertItem(h,,"Item 2"),"Task",2001-01-03,2001-01-05)
	var_Items.ExpandItem(h,true)
	h = var_Items.AddItem("Project 2")
	var_Items.CellHasCheckBox(h,0,true)
	var_Items.CellState(h,0,1)
	var_Items.AddBar(var_Items.InsertItem(h,,"Item 1"),"Task",2001-01-04,2001-01-07)
	var_Items.AddBar(var_Items.InsertItem(h,,"Item 2"),"Task",2001-01-06,2001-01-08)
	var_Items.ExpandItem(h,true)
|
|
917
|
How can I show the histogram for checked item and all recursively child items
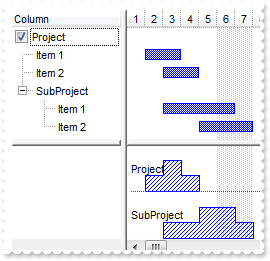
OleObject oG2antt,var_Chart,var_Items
any h

oG2antt = ole_1.Object
oG2antt.BeginUpdate()
var_Chart = oG2antt.Chart
	var_Chart.PaneWidth(false,128)
	var_Chart.FirstVisibleDate = 2001-01-01
	var_Chart.HistogramVisible = true
	var_Chart.HistogramHeight = 128
	var_Chart.HistogramView = 788 /*exHistogramRecLeafItems | exHistogramLeafItems | exHistogramUnlockedItems | exHistogramCheckedItems*/
	var_Chart.Bars.Item("Task").HistogramPattern = 6
oG2antt.Columns.Add("Column")
var_Items = oG2antt.Items
	h = var_Items.AddItem("Project")
	var_Items.CellHasCheckBox(h,0,true)
	var_Items.CellState(h,0,1)
	var_Items.AddBar(var_Items.InsertItem(h,,"Item 1"),"Task",2001-01-02,2001-01-04)
	var_Items.AddBar(var_Items.InsertItem(h,,"Item 2"),"Task",2001-01-03,2001-01-05)
	var_Items.ExpandItem(h,true)
	h = var_Items.InsertItem(h,,"SubProject")
	var_Items.AddBar(var_Items.InsertItem(h,,"Item 1"),"Task",2001-01-03,2001-01-07)
	var_Items.AddBar(var_Items.InsertItem(h,,"Item 2"),"Task",2001-01-05,2001-01-08)
	var_Items.ExpandItem(h,true)
oG2antt.EndUpdate()
|
|
916
|
How can I show the histogram for checked item and its child items
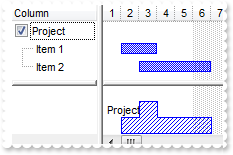
OleObject oG2antt,var_Chart,var_Items
any h

oG2antt = ole_1.Object
var_Chart = oG2antt.Chart
	var_Chart.FirstVisibleDate = 2001-01-01
	var_Chart.HistogramVisible = true
	var_Chart.HistogramHeight = 32
	var_Chart.HistogramView = 276 /*exHistogramLeafItems | exHistogramUnlockedItems | exHistogramCheckedItems*/
	var_Chart.Bars.Item("Task").HistogramPattern = 6
oG2antt.Columns.Add("Column")
var_Items = oG2antt.Items
	h = var_Items.AddItem("Project")
	var_Items.CellHasCheckBox(h,0,true)
	var_Items.AddBar(var_Items.InsertItem(h,,"Item 1"),"Task",2001-01-02,2001-01-04)
	var_Items.AddBar(var_Items.InsertItem(h,,"Item 2"),"Task",2001-01-03,2001-01-07)
	var_Items.ExpandItem(h,true)
|
|
915
|
How can I show the histogram for all items
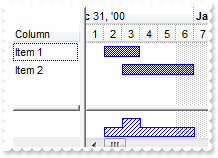
OleObject oG2antt,var_Chart,var_Items

oG2antt = ole_1.Object
oG2antt.BeginUpdate()
oG2antt.SingleSel = false
var_Chart = oG2antt.Chart
	var_Chart.FirstVisibleDate = 2001-01-01
	var_Chart.LevelCount = 2
	var_Chart.HistogramVisible = true
	var_Chart.HistogramHeight = 32
	var_Chart.HistogramView = 112
	var_Chart.Bars.Item("Task").HistogramPattern = 6
oG2antt.Columns.Add("Column")
var_Items = oG2antt.Items
	var_Items.AddBar(var_Items.AddItem("Item 1"),"Task",2001-01-02,2001-01-04)
	var_Items.AddBar(var_Items.AddItem("Item 2"),"Task",2001-01-03,2001-01-07)
oG2antt.EndUpdate()
|
|
914
|
How can I prevent selecting a new item when clicking the chart area so my selection is shown in the histogram
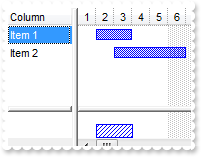
OleObject oG2antt,var_Chart,var_Items

oG2antt = ole_1.Object
oG2antt.SingleSel = false
var_Chart = oG2antt.Chart
	var_Chart.SelectOnClick = false
	var_Chart.FirstVisibleDate = 2001-01-01
	var_Chart.HistogramVisible = true
	var_Chart.HistogramHeight = 32
	var_Chart.HistogramView = 2
	var_Chart.Bars.Item("Task").HistogramPattern = 6
oG2antt.Columns.Add("Column")
var_Items = oG2antt.Items
	var_Items.AddBar(var_Items.AddItem("Item 1"),"Task",2001-01-02,2001-01-04)
	var_Items.AddBar(var_Items.AddItem("Item 2"),"Task",2001-01-03,2001-01-07)
	var_Items.SelectItem(var_Items.ItemByIndex(0),true)
|
|
913
|
How can I show bars in the histogram for selected items only
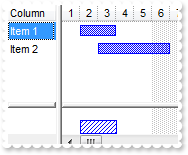
OleObject oG2antt,var_Chart,var_Items

oG2antt = ole_1.Object
oG2antt.SingleSel = false
var_Chart = oG2antt.Chart
	var_Chart.FirstVisibleDate = 2001-01-01
	var_Chart.HistogramVisible = true
	var_Chart.HistogramHeight = 32
	var_Chart.HistogramView = 2
	var_Chart.Bars.Item("Task").HistogramPattern = 6
oG2antt.Columns.Add("Column")
var_Items = oG2antt.Items
	var_Items.AddBar(var_Items.AddItem("Item 1"),"Task",2001-01-02,2001-01-04)
	var_Items.AddBar(var_Items.AddItem("Item 2"),"Task",2001-01-03,2001-01-07)
	var_Items.SelectItem(var_Items.ItemByIndex(0),true)
|
|
912
|
How can I change the color and size for the curve in the histogram
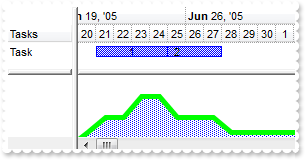
OleObject oG2antt,var_Bar,var_Chart,var_Items
any h1

oG2antt = ole_1.Object
oG2antt.BeginUpdate()
oG2antt.Columns.Add("Tasks")
var_Chart = oG2antt.Chart
	var_Chart.LevelCount = 2
	var_Chart.NonworkingDays = 0
	var_Chart.PaneWidth(false,64)
	var_Chart.FirstVisibleDate = 2005-06-20
	var_Chart.HistogramVisible = true
	var_Chart.HistogramHeight = 68
	var_Bar = var_Chart.Bars.Item("Task")
		var_Bar.HistogramPattern = 258 /*0x100 | exPatternDot*/
		var_Bar.HistogramBorderColor = RGB(0,255,0)
		var_Bar.HistogramBorderSize = 5
var_Items = oG2antt.Items
	h1 = var_Items.AddItem("Task")
	var_Items.AddBar(h1,"Task",2005-06-21,2005-06-25,1,1)
	var_Items.AddBar(h1,"Task",2005-06-23,2005-06-28,2,2)
oG2antt.EndUpdate()
|
|
911
|
How can I change the color for the frame in the histogram
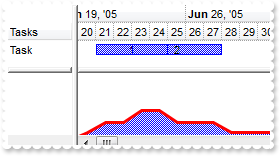
OleObject oG2antt,var_Bar,var_Chart,var_Items
any h1

oG2antt = ole_1.Object
oG2antt.BeginUpdate()
oG2antt.Columns.Add("Tasks")
var_Chart = oG2antt.Chart
	var_Chart.LevelCount = 2
	var_Chart.NonworkingDays = 0
	var_Chart.PaneWidth(false,64)
	var_Chart.FirstVisibleDate = 2005-06-20
	var_Chart.HistogramVisible = true
	var_Chart.HistogramHeight = 68
	var_Bar = var_Chart.Bars.Item("Task")
		var_Bar.HistogramPattern = 259 /*0x100 | exPatternShadow*/
		var_Bar.HistogramItems = 5
		var_Bar.HistogramBorderColor = RGB(255,0,0)
var_Items = oG2antt.Items
	h1 = var_Items.AddItem("Task")
	var_Items.AddBar(h1,"Task",2005-06-21,2005-06-25,1,1)
	var_Items.AddBar(h1,"Task",2005-06-23,2005-06-28,2,2)
oG2antt.EndUpdate()
|
|
910
|
How can I force the histogram for a bar being shown all the time
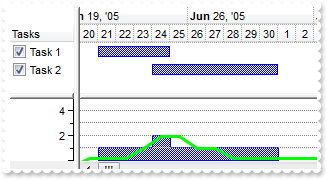
OleObject oG2antt,var_Bar,var_Bar1,var_Chart,var_Items
any h1

oG2antt = ole_1.Object
oG2antt.BeginUpdate()
oG2antt.ScrollBySingleLine = true
oG2antt.Columns.Add("Tasks").Def(0,true)
var_Chart = oG2antt.Chart
	var_Chart.LevelCount = 2
	var_Chart.NonworkingDays = 0
	var_Chart.PaneWidth(false,64)
	var_Chart.FirstVisibleDate = 2005-06-20
	var_Chart.HistogramVisible = true
	var_Chart.HistogramHeight = 68
	var_Chart.HistogramView = 20 /*exHistogramUnlockedItems | exHistogramCheckedItems*/
	var_Bar = var_Chart.Bars.Copy("Task","H")
		var_Bar.Color = RGB(0,255,0)
		var_Bar.HistogramPattern = 256 /*0x100 | */
		var_Bar.HistogramItems = 5
		var_Bar.HistogramColor = var_Bar.Color
		var_Bar.HistogramGridLinesColor = RGB(128,128,128)
		var_Bar.HistogramRulerLinesColor = RGB(0,0,1)
	var_Bar1 = var_Chart.Bars.Item("Task")
		var_Bar1.HistogramCriticalColor = RGB(0,0,128)
		var_Bar1.HistogramPattern = var_Bar1.Pattern
		var_Bar1.HistogramItems = 5
		var_Bar1.HistogramGridLinesColor = RGB(128,128,128)
		var_Bar1.HistogramRulerLinesColor = RGB(0,0,1)
var_Items = oG2antt.Items
	h1 = var_Items.AddItem("Hidden")
	var_Items.AddBar(h1,"H",2005-06-23,2005-06-28,1)
	var_Items.AddBar(h1,"H",2005-06-24,2005-06-26,2)
	var_Items.CellState(h1,0,1)
	var_Items.ItemHeight(h1,0)
	var_Items.SelectableItem(h1,false)
	h1 = var_Items.AddItem("Task 1")
	var_Items.AddBar(h1,"Task",2005-06-21,2005-06-25,1)
	var_Items.CellState(h1,0,1)
	h1 = var_Items.AddItem("Task 2")
	var_Items.CellState(h1,0,1)
	var_Items.AddBar(h1,"Task",2005-06-24,2005-07-01,1)
oG2antt.EndUpdate()
|
|
909
|
How can I remove a bar type from the histogram
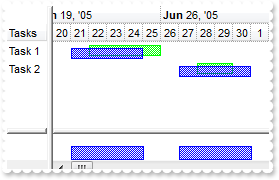
OleObject oG2antt,var_Bar,var_Bar1,var_Bar2,var_Chart,var_Items
any h1

oG2antt = ole_1.Object
oG2antt.BeginUpdate()
oG2antt.Columns.Add("Tasks")
var_Chart = oG2antt.Chart
	var_Chart.LevelCount = 2
	var_Chart.NonworkingDays = 0
	var_Chart.PaneWidth(false,40)
	var_Chart.FirstVisibleDate = 2005-06-20
	var_Chart.HistogramVisible = true
	var_Chart.HistogramHeight = 32
	var_Bar = var_Chart.Bars.Item("Task")
		var_Bar.HistogramCriticalColor = RGB(0,0,128)
		var_Bar.HistogramPattern = var_Bar.Pattern
	var_Bar1 = var_Chart.Bars.Copy("Task","Green")
		var_Bar1.Color = RGB(0,255,0)
		var_Bar1.HistogramPattern = var_Bar1.Pattern
var_Items = oG2antt.Items
	h1 = var_Items.AddItem("Task 1")
	var_Items.AddBar(h1,"Green",2005-06-22,2005-06-26,0)
	var_Items.AddBar(h1,"Task",2005-06-21,2005-06-25,1)
	var_Items.ItemBar(h1,1,18,3)
	h1 = var_Items.AddItem("Task 2")
	var_Items.AddBar(h1,"Green",2005-06-28,2005-06-30,0)
	var_Items.AddBar(h1,"Task",2005-06-27,2005-07-01,1)
	var_Items.ItemBar(h1,1,18,3)
var_Bar2 = oG2antt.Chart.Bars.Item("Green")
	var_Bar2.HistogramColor = var_Bar2.Color
	var_Bar2.HistogramPattern = 0
oG2antt.EndUpdate()
|
|
908
|
How can I show the two buttons in the vertical splitter but still resizes the chart when the control gets resized

OleObject oG2antt

oG2antt = ole_1.Object
oG2antt.OnResizeControl = 513 /*exSplitterShowButtons | exResizeChart*/
oG2antt.Chart.PaneWidth(false,96)
oG2antt.Chart.LevelCount = 2
|
|
907
|
I have seen a screen shot on your web page that shows two buttons on the vertical scroll bar. How can I show them
OleObject oG2antt

oG2antt = ole_1.Object
oG2antt.OnResizeControl = 512
oG2antt.Chart.PaneWidth(false,96)
|
|
906
|
How can I disable selecting a new item once the user clicks the chart area
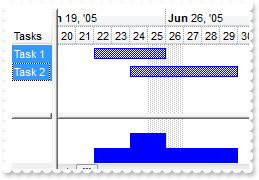
OleObject oG2antt,var_Chart,var_Items
any h1

oG2antt = ole_1.Object
oG2antt.BeginUpdate()
oG2antt.Columns.Add("Tasks")
oG2antt.SingleSel = false
var_Chart = oG2antt.Chart
	var_Chart.SelectOnClick = false
	var_Chart.AllowCreateBar = 1
	var_Chart.LevelCount = 2
	var_Chart.PaneWidth(false,40)
	var_Chart.FirstVisibleDate = 2005-06-20
	var_Chart.HistogramVisible = true
	var_Chart.HistogramHeight = 32
	var_Chart.HistogramView = 2
	var_Chart.Bars.Item("Task").HistogramPattern = 1
var_Items = oG2antt.Items
	h1 = var_Items.AddItem("Task 1")
	var_Items.AddBar(h1,"Task",2005-06-22,2005-06-26,0)
	var_Items.SelectItem(h1,true)
	h1 = var_Items.AddItem("Task 2")
	var_Items.AddBar(h1,"Task",2005-06-24,2005-06-30,0)
	var_Items.SelectItem(h1,true)
oG2antt.EndUpdate()
|
|
905
|
Is there any option to display the chart's header in the bottom side of the histogram
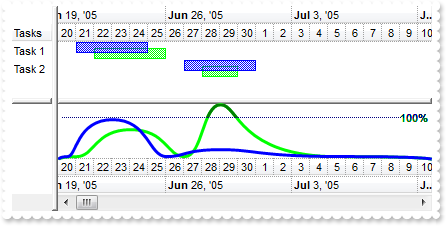
OleObject oG2antt,var_Bar,var_Bar1,var_Chart,var_Items
any h1

oG2antt = ole_1.Object
oG2antt.BeginUpdate()
oG2antt.Columns.Add("Tasks")
var_Chart = oG2antt.Chart
	var_Chart.LevelCount = 2
	var_Chart.NonworkingDays = 0
	var_Chart.PaneWidth(false,40)
	var_Chart.FirstVisibleDate = 2005-06-20
	var_Chart.HistogramVisible = true
	var_Chart.HistogramView = 112
	var_Chart.HistogramHeight = 96
	var_Chart.HistogramHeaderVisible = true
	var_Bar = var_Chart.Bars.Item("Task")
		var_Bar.Color = RGB(0,0,255)
		var_Bar.OverlaidType = 1
		var_Bar.OverlaidGroup = "Task2"
		var_Bar.HistogramCriticalColor = RGB(0,0,128)
		var_Bar.HistogramPattern = 512
		var_Bar.HistogramType = 1
	var_Bar1 = var_Chart.Bars.Copy("Task","Task2")
		var_Bar1.Color = RGB(0,255,0)
		var_Bar1.OverlaidType = 1
		var_Bar1.OverlaidGroup = "Task"
		var_Bar1.HistogramCriticalColor = RGB(0,128,0)
		var_Bar1.HistogramPattern = 512
		var_Bar1.HistogramType = 1
var_Items = oG2antt.Items
	h1 = var_Items.AddItem("Task 1")
	var_Items.AddBar(h1,"Task2",2005-06-22,2005-06-26,0)
	var_Items.AddBar(h1,"Task",2005-06-21,2005-06-25,1)
	var_Items.ItemBar(h1,0,21,3)
	var_Items.ItemBar(h1,1,21,4)
	h1 = var_Items.AddItem("Task 2")
	var_Items.AddBar(h1,"Task2",2005-06-28,2005-06-30,0)
	var_Items.AddBar(h1,"Task",2005-06-27,2005-07-01,1)
	var_Items.ItemBar(h1,0,21,4)
	var_Items.ItemBar(h1,1,21,1)
oG2antt.EndUpdate()
|
|
904
|
How can I display the child bars as soon as an item gets collapsed
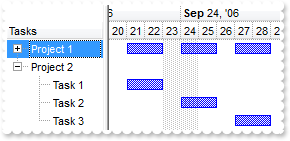
OleObject oG2antt,var_Chart,var_Items
any h,h1,h2,h3

oG2antt = ole_1.Object
oG2antt.BeginUpdate()
oG2antt.LinesAtRoot = -1
oG2antt.Columns.Add("Tasks")
var_Chart = oG2antt.Chart
	var_Chart.FirstVisibleDate = 2006-09-20
	var_Chart.ShowCollapsedBars = true
	var_Chart.LevelCount = 2
	var_Chart.PaneWidth(false,96)
var_Items = oG2antt.Items
	h = var_Items.AddItem("Project 1")
	h1 = var_Items.InsertItem(h,,"Task 1")
	var_Items.AddBar(h1,"Task",2006-09-21,2006-09-23,"A")
	h2 = var_Items.InsertItem(h,,"Task 2")
	var_Items.AddBar(h2,"Task",2006-09-24,2006-09-26,"B")
	h3 = var_Items.InsertItem(h,,"Task 3")
	var_Items.AddBar(h3,"Task",2006-09-27,2006-09-29,"C")
	h = var_Items.AddItem("Project 2")
	h1 = var_Items.InsertItem(h,,"Task 1")
	var_Items.AddBar(h1,"Task",2006-09-21,2006-09-23,"A")
	h2 = var_Items.InsertItem(h,,"Task 2")
	var_Items.AddBar(h2,"Task",2006-09-24,2006-09-26,"B")
	h3 = var_Items.InsertItem(h,,"Task 3")
	var_Items.AddBar(h3,"Task",2006-09-27,2006-09-29,"C")
	var_Items.ExpandItem(h,true)
oG2antt.EndUpdate()
|
|
903
|
What exBarEffort property represents
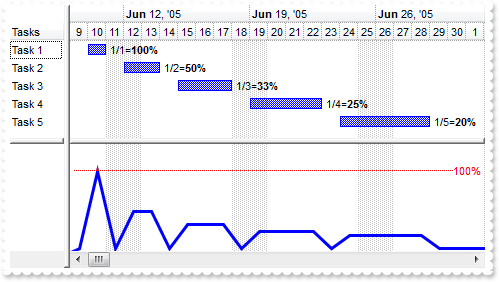
OleObject oG2antt,var_Bar,var_Chart,var_Items
any h1

oG2antt = ole_1.Object
oG2antt.BeginUpdate()
oG2antt.Columns.Add("Tasks")
var_Chart = oG2antt.Chart
	var_Chart.LevelCount = 2
	var_Chart.PaneWidth(false,40)
	var_Chart.FirstVisibleDate = 2005-06-09
	var_Chart.HistogramVisible = true
	var_Chart.HistogramView = 112
	var_Chart.HistogramHeight = 164
	var_Bar = var_Chart.Bars.Item("Task")
		var_Bar.HistogramPattern = 256 /*0x100 | */
		var_Bar.HistogramType = 1
var_Items = oG2antt.Items
	h1 = var_Items.AddItem("Task 1")
	var_Items.AddBar(h1,"Task",2005-06-10,2005-06-11,,"1/1=<b>100%")
	var_Items.ItemBar(h1,,4,18)
	h1 = var_Items.AddItem("Task 2")
	var_Items.AddBar(h1,"Task",2005-06-12,2005-06-14,,"1/2=<b>50%")
	var_Items.ItemBar(h1,,4,18)
	h1 = var_Items.AddItem("Task 3")
	var_Items.AddBar(h1,"Task",2005-06-15,2005-06-18,,"1/3=<b>33%")
	var_Items.ItemBar(h1,,4,18)
	h1 = var_Items.AddItem("Task 4")
	var_Items.AddBar(h1,"Task",2005-06-19,2005-06-23,,"1/4=<b>25%")
	var_Items.ItemBar(h1,,4,18)
	h1 = var_Items.AddItem("Task 5")
	var_Items.AddBar(h1,"Task",2005-06-24,2005-06-29,,"1/5=<b>20%")
	var_Items.ItemBar(h1,,4,18)
oG2antt.EndUpdate()
|
|
902
|
Can I display multiple curves in the histogram
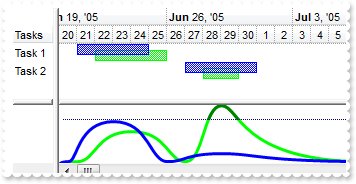
OleObject oG2antt,var_Bar,var_Bar1,var_Chart,var_Items
any h1

oG2antt = ole_1.Object
oG2antt.BeginUpdate()
oG2antt.Columns.Add("Tasks")
var_Chart = oG2antt.Chart
	var_Chart.LevelCount = 2
	var_Chart.NonworkingDays = 0
	var_Chart.PaneWidth(false,40)
	var_Chart.FirstVisibleDate = 2005-06-20
	var_Chart.HistogramVisible = true
	var_Chart.HistogramView = 112
	var_Chart.HistogramHeight = 64
	var_Bar = var_Chart.Bars.Item("Task")
		var_Bar.Color = RGB(0,0,255)
		var_Bar.OverlaidType = 1
		var_Bar.OverlaidGroup = "Task2"
		var_Bar.HistogramCriticalColor = RGB(0,0,128)
		var_Bar.HistogramPattern = 512
		var_Bar.HistogramType = 1
	var_Bar1 = var_Chart.Bars.Copy("Task","Task2")
		var_Bar1.Color = RGB(0,255,0)
		var_Bar1.OverlaidType = 1
		var_Bar1.OverlaidGroup = "Task"
		var_Bar1.HistogramCriticalColor = RGB(0,128,0)
		var_Bar1.HistogramPattern = 512
		var_Bar1.HistogramType = 1
var_Items = oG2antt.Items
	h1 = var_Items.AddItem("Task 1")
	var_Items.AddBar(h1,"Task2",2005-06-22,2005-06-26,0)
	var_Items.AddBar(h1,"Task",2005-06-21,2005-06-25,1)
	var_Items.ItemBar(h1,0,21,3)
	var_Items.ItemBar(h1,1,21,4)
	h1 = var_Items.AddItem("Task 2")
	var_Items.AddBar(h1,"Task2",2005-06-28,2005-06-30,0)
	var_Items.AddBar(h1,"Task",2005-06-27,2005-07-01,1)
	var_Items.ItemBar(h1,0,21,4)
	var_Items.ItemBar(h1,1,21,1)
oG2antt.EndUpdate()
|
|
901
|
How can I use the exBarEffort property
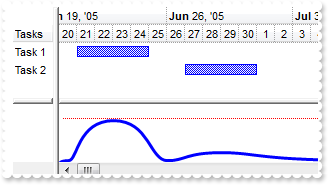
OleObject oG2antt,var_Bar,var_Chart,var_Items
any h1

oG2antt = ole_1.Object
oG2antt.BeginUpdate()
oG2antt.Columns.Add("Tasks")
var_Chart = oG2antt.Chart
	var_Chart.LevelCount = 2
	var_Chart.NonworkingDays = 0
	var_Chart.PaneWidth(false,40)
	var_Chart.FirstVisibleDate = 2005-06-20
	var_Chart.HistogramVisible = true
	var_Chart.HistogramHeight = 64
	var_Chart.HistogramView = 112
	var_Bar = var_Chart.Bars.Item("Task")
		var_Bar.HistogramCriticalColor = RGB(255,0,0)
		var_Bar.HistogramPattern = 512
		var_Bar.HistogramType = 1
var_Items = oG2antt.Items
	h1 = var_Items.AddItem("Task 1")
	var_Items.AddBar(h1,"Task",2005-06-21,2005-06-25)
	var_Items.ItemBar(h1,"",21,4)
	h1 = var_Items.AddItem("Task 2")
	var_Items.AddBar(h1,"Task",2005-06-27,2005-07-01)
	var_Items.ItemBar(h1,"",21,1)
oG2antt.EndUpdate()
|